
Dear Investors,
The market is whispering again.
And if you pause, clear the noise, and really listen, you can hear it: the tone is changing.
It’s not yet a scream, not even a shout- but the rhythm has shifted.
Behind every chart, every ratio, every quiet shift in pricing, I see a larger pattern forming.
And it’s one that echoes past transitions, past breakouts, and past inflection points that have shaped investment cycles for decades.
Over the past few weeks, I’ve been closely watching the early stages of earnings season, and what I’m seeing is far more than a passing trend.
Just 11% of the S&P 500 has reported so far, and already 85% of those companies have beaten expectations.
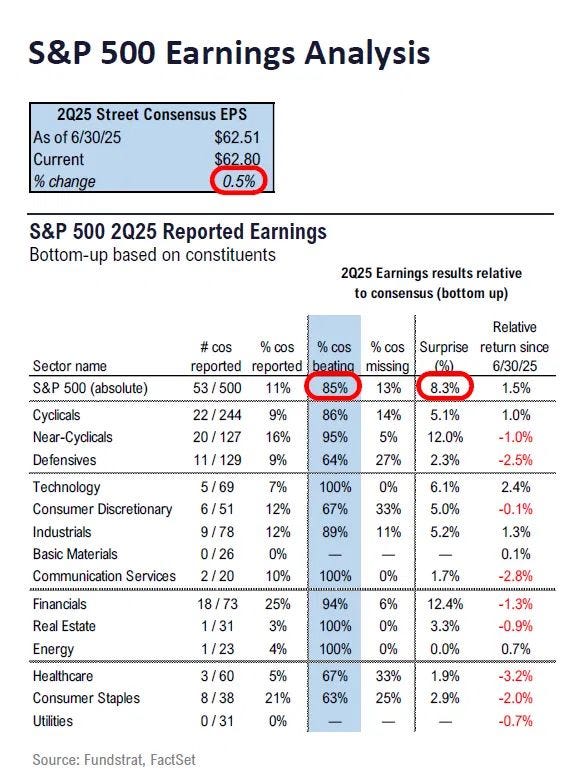
These aren’t marginal beats – they’re averaging an 8.3% surprise on EPS.
That’s significant.
That kind of broad-based earnings strength hasn’t shown up with this kind of consistency since the early months of 2021.
And back then, with the world reopening and liquidity still flowing like a river, the S&P 500 rewarded those fundamentals with a 14% rally in just three months.
But beyond the surface-level strength in quarterly reports, there’s a shift happening in expectations – and that’s often where real market moves are born.
The Citi Earnings Revision Index has finally flipped positive after 15 consecutive months of downgrades.
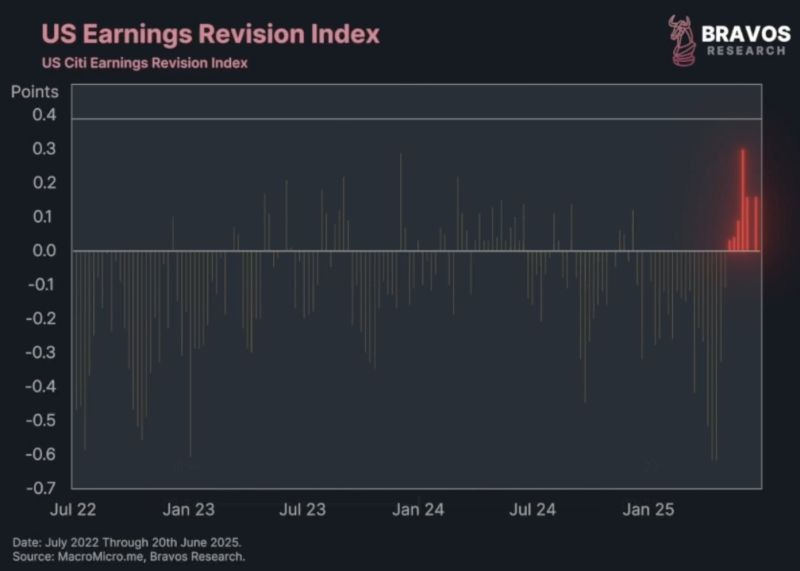
That may sound like a minor technical indicator, but I’ve learned over the years that when analysts stop cutting and start upgrading, it’s not just a reaction to good news.
It’s a reflection of a deeper shift in business confidence.
It’s happened before – in mid-2016 and mid-2020 – and both times, the market followed with strong quarterly returns averaging 6.5%.
The return of risk, and a flashback to 1999
As earnings firm up and revisions rise, the more speculative corners of the market are starting to light up.
The Goldman Sachs Non-Profitable Tech Index – a poster child for risk appetite – has soared 66% since its April lows.
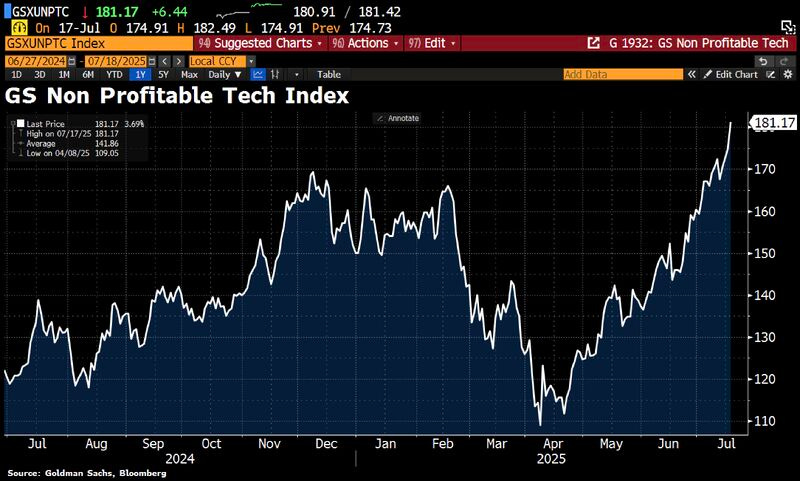
These are companies that were effectively written off during the rate-tightening cycle, dismissed as uninvestable in a higher cost-of-capital environment.
But now, they’re back in favor.
And that tells me that liquidity is not just present, it’s starting to move into riskier and more volatile pockets.
I can’t ignore the echoes of 1999.
During that final phase of the late 90s bull market, non-profitable tech stocks rose more than 120% in under a year.
That rally ended in a crash, yes, but before it did, it reshaped the entire investor psychology around innovation, growth, and momentum.
It’s not that we’re repeating that script verbatim – but when unprofitable names rip higher, and when speculative capital starts flowing again, it’s a sign that we’re entering a different regime.
Risk appetite, once dormant, is awake again.
That resurgence in risk is happening against the backdrop of something even more powerful: a subtle but meaningful breakout in inflation expectations.
The 10-year breakeven has climbed to 2.44%, breaking through a 3-year downtrend and hitting its highest level since early 2023.
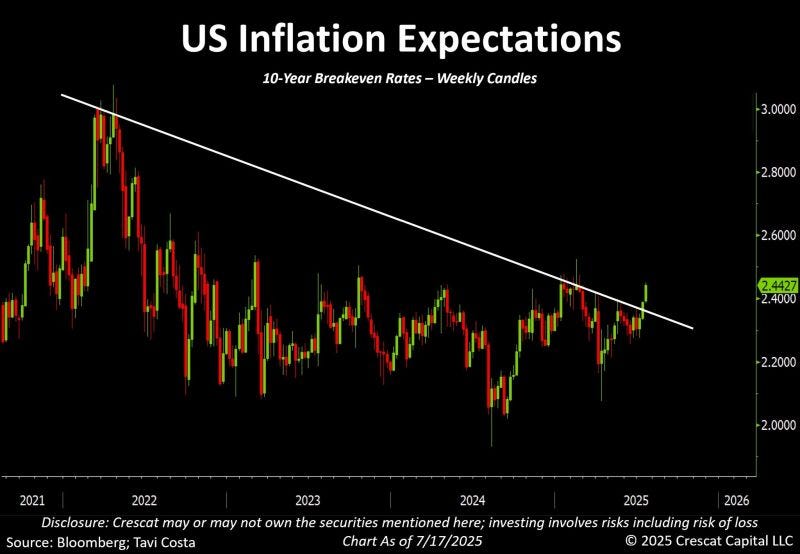
These breakevens aren’t just economic forecasts – they’re embedded market prices that reflect real-time shifts in investor psychology.
In past cycles – in 2010, 2016, and especially in 2021 – similar breakouts preceded commodity rallies averaging 18% over the following six months.
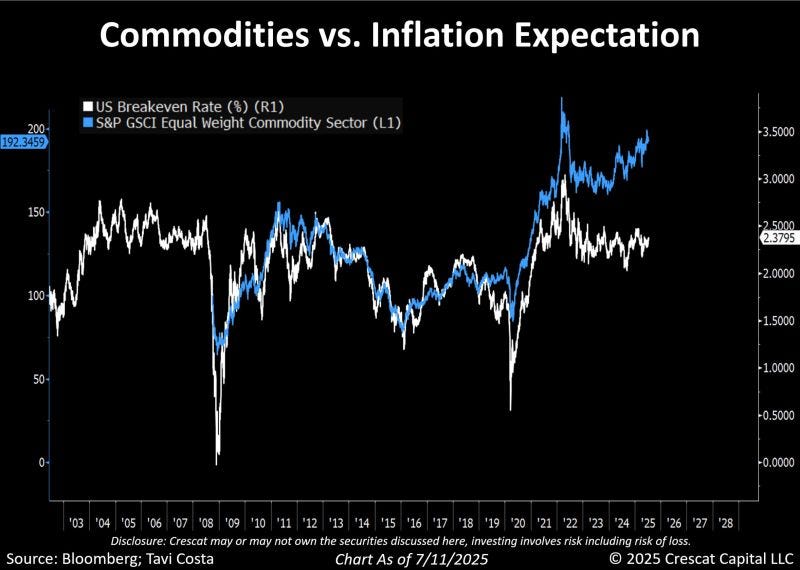
The S&P GSCI Equal Weight Commodity Index is starting to confirm that move, gaining strength just as commodities ex-gold begin to outperform.
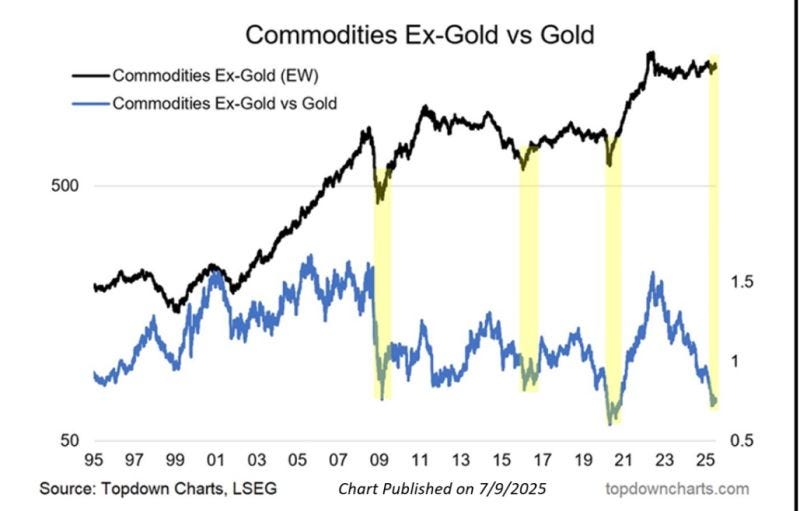
That pattern is not new. In 2009, 2016, and again in 2020, we saw these same signals precede strong rallies in energy and industrial metals.
In the second quarter of 2020, for example, oil surged 30% while copper climbed 25%.
These aren’t isolated moves – they’re the early signs of a potential rotation into hard assets and inflation-sensitive sectors.
The dollar, valuations, and the weight of history
While risk assets and commodities gather momentum, the U.S. dollar has quietly started to fade.
Yes, we’ve seen a short-term bounce. But when you zoom out, the structural picture remains bearish.
The DXY is now deep into the third phase of its 10-year secular downtrend, with the 10-year rolling return hovering just above zero.
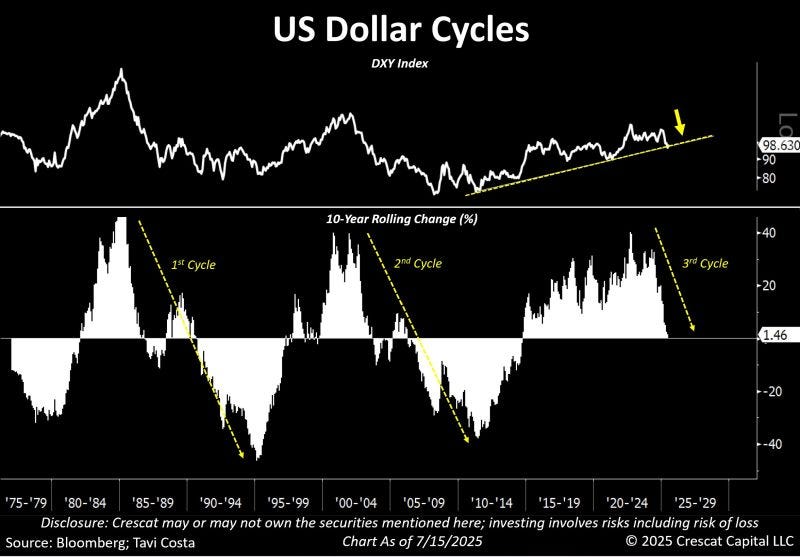
In both the 1985-1995 and 2002–2011 cycles, when the dollar’s 10-year return fell below 5%, it signaled prolonged weakness.
In the years that followed, the dollar lost 12% to 15%, while emerging market equities outperformed the S&P 500 by more than 25 percentage points.
This structural decline matters. When the dollar weakens, it tends to unleash capital flows into global risk assets.
It boosts commodities, supports emerging markets, and reduces financial tightening pressures for large swaths of the world.
A fading dollar, in combination with rising breakevens, paints a very different macro backdrop than the one we’ve lived in for most of the past two years.
Now let’s turn to valuations.
The S&P 500 is trading at a forward P/E of 22.2x – identical to early 2021.
But there’s a key difference: the Fed Funds Rate was zero then.
Today it’s 4.25%.
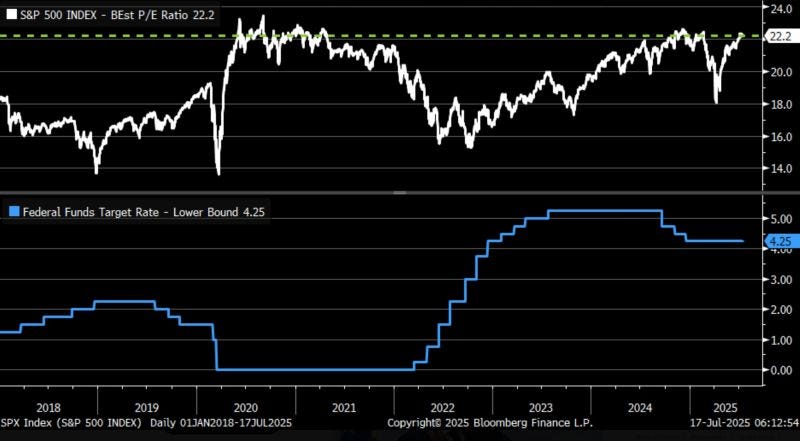
The equity risk premium – the excess return investors demand to hold stocks over bonds – has narrowed to one of its lowest levels in modern history.
In 2021, low rates made high multiples feel rational.
Today, they feel more fragile. The cost of capital has returned, and with it, a higher bar for growth.
Seasonality, sentiment, and what comes next
There’s one more signal I’ve been thinking about – one that has nothing to do with charts or fundamentals. It’s about timing.
Since 1950, the S&P 500 has delivered most of its July gains in the first 17 days of the month.
The average return from July 1 to July 17 is 0.9%, while the second half of the month sees only 0.2%.
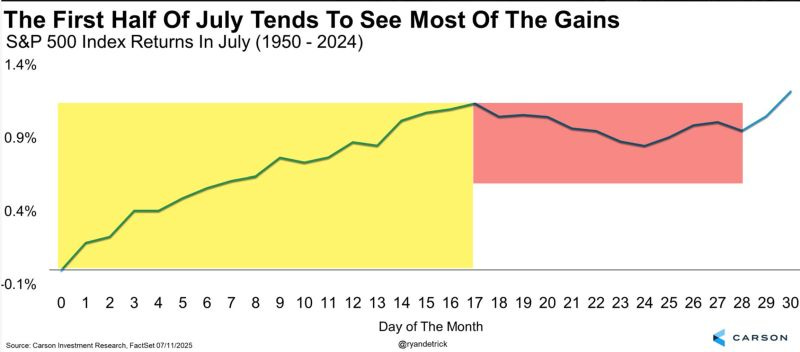
This year, after a 26% rally from the October lows, it wouldn’t surprise me to see the market take a breather.
Not because of fear – but because cycles breathe.
So where does that leave us?
It leaves us in a moment of tension – and of possibility.
Earnings are not just holding up; they’re exceeding expectations.
Inflation expectations are stirring back to life.
Commodities are perking up.
The dollar’s strength looks more like a pause than a reversal.
Valuations are elevated, but earnings revisions are finally offering support.
And beneath it all, sentiment is shifting toward reflation.
It reminds me of 2009. Of 2016. Of those moments when narratives flipped, when forgotten asset classes came roaring back, and when macro signals aligned to tell a different story.
In both of those years, small caps, value stocks, and hard assets outperformed.
In both cases, inflation expectations moved up just as the dollar slipped.
In both, the market shifted from caution to conviction.
What I’m watching now is clear: I want to see the earnings beats continue, especially from the mega-cap leaders like Apple, Microsoft, and Nvidia.
I want to see breakevens break above 2.5%, a level that unlocked a 25% commodity rally in 2021.
And I’m listening carefully to the Fed – not just to what they say, but to what they hint: the tone, the pauses, the pivots.
This is one of those moments where macro, sentiment, and price are coming together.
Not in a frenzy – but in quiet, steady alignment. And when they do, I pay very close attention.