
Dear Investors,
This past weekend, as I followed the news coming out of Scotland, I couldn’t help but think about how history sometimes unfolds in unexpected ways.
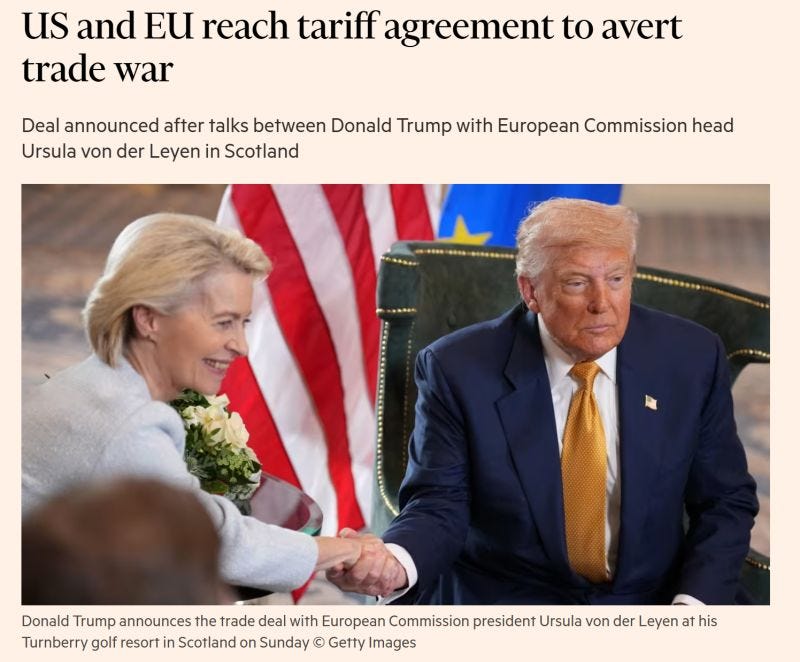
At Trump’s Turnberry resort, the United States and the European Union struck what is being called a landmark trade deal, a pact that spares us from the brink of a transatlantic trade war that had been looming for months.
It was one of those moments that reminds me why we study macroeconomics so closely – because when big changes like this happen, they ripple through every corner of the market, affecting everything from stock prices to bond yields to the currencies we track every day.
The Deal That Changes the Game
Let me paint the picture: certain goods will now benefit from 0% tariffs, yet a broad 15% tariff remains on most EU exports – cars, pharmaceuticals, semiconductors – while the EU commits to purchasing $750 billion in US energy and a significant amount of American defense equipment.
When Trump stood up and called it “the biggest deal ever reached in any capacity,” it sounded dramatic, but I can’t deny that these numbers carry real weight.
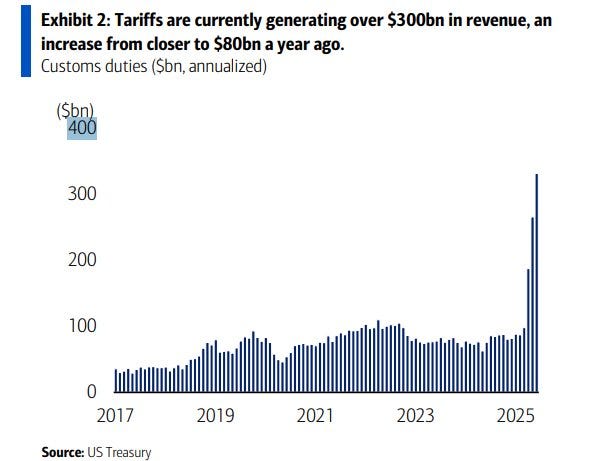
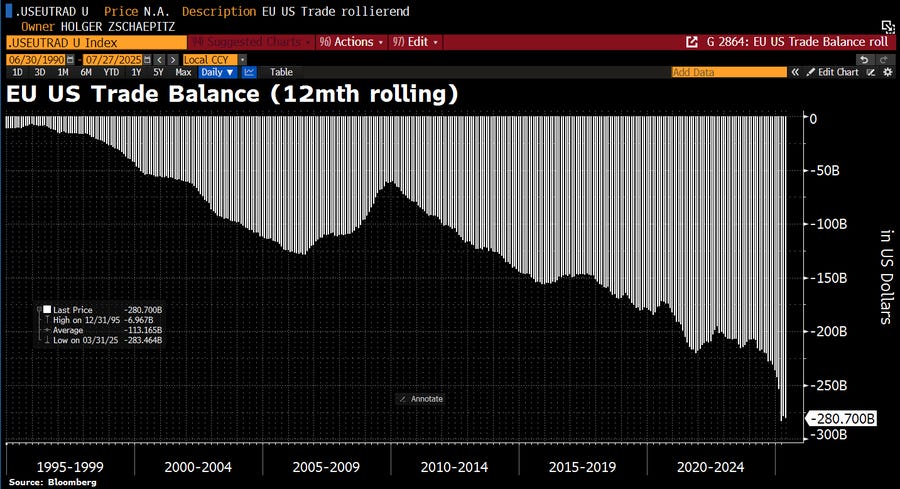
And when you see the EU-US trade deficit now sitting at -$280.7B, alongside tariff revenues surging to over $300B annually – a leap from just $80B a year ago – it’s hard to ignore the scale of what’s unfolding.
Trump’s talk of $3 trillion in revenue over the next decade may seem ambitious, but it reveals the magnitude of his intent.
This isn’t just about trade policy; it’s about redefining economic priorities on a global stage.
Looking Back to Look Ahead
History is my favorite guide when facing moments like this.
I remember the 2018-2019 trade tensions vividly: the S&P 500 dropped -6% in Q2 2018 as markets absorbed the shock, only to rebound +12% over the next two quarters as deals began to form.
Treasury yields climbed +40bps, signaling shifting growth expectations, and the EUR/USD weakened by -3.5% as capital chased US assets.
These patterns don’t just tell us where we’ve been – they help us anticipate what might come next.
If history teaches us anything, it’s that markets tend to overreact in the short term before recalibrating once clarity emerges.
I’ve learned that these moments of recalibration are often when the most compelling opportunities present themselves.
Markets on Edge
This week adds another layer of complexity.
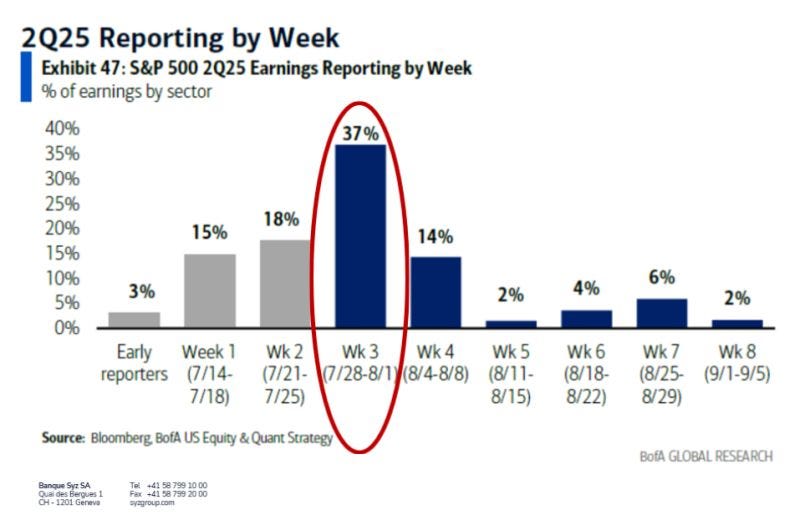
We’re heading into the most critical part of earnings season: 37% of the S&P 500 – including $MSFT, $AAPL, $AMZN, and $META – are reporting.
Weeks like this have pushed the VIX up by an average of +12%, a reminder of how quickly sentiment can shift.
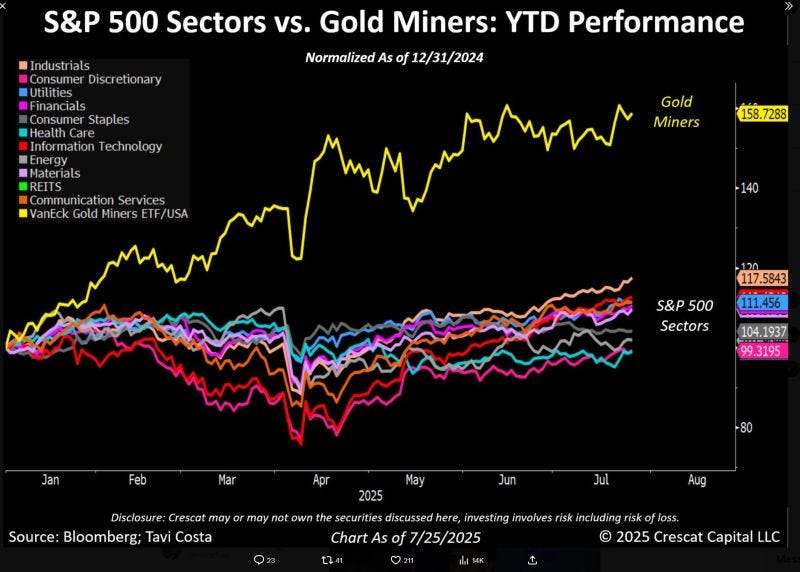
Meanwhile, gold miners have been on a tear, up +158% ytd, echoing their +120% surge in 2016 when global uncertainty drove investors to hedge aggressively.
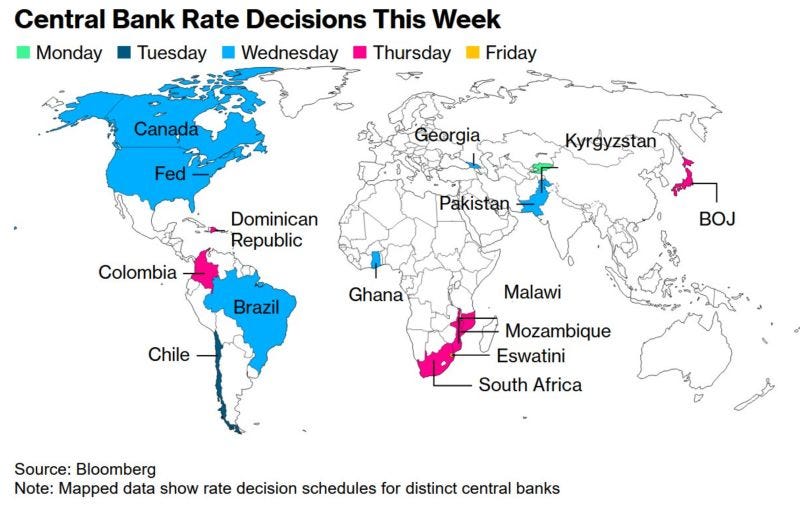
And with the Fed, the Bank of Canada, and the BOJ all making rate decisions this week, I’m reminded of how late-cycle pauses from the Fed have historically led to +4% equity gains over the following three months.
These aren’t isolated data points – they’re part of the story we’re living right now, and they form the mosaic we use to anticipate what lies ahead.
Why This Matters for Us
This agreement removes one enormous geopolitical risk, but it doesn’t clear the path entirely.
As I think through my own strategy, I’m watching autos, pharmaceuticals, energy, and gold – sectors that will feel the weight of this deal most directly.
And I can’t overstate how much Big Tech’s earnings this week will shape the market’s tone for Q3 and possibly the rest of 2025.
These companies are bellwethers for risk sentiment, and their results will reverberate far beyond their own stock prices.
The quiet of summer often lulls us into complacency, but history tells us that August is when volatility wakes up, often running through September and October.
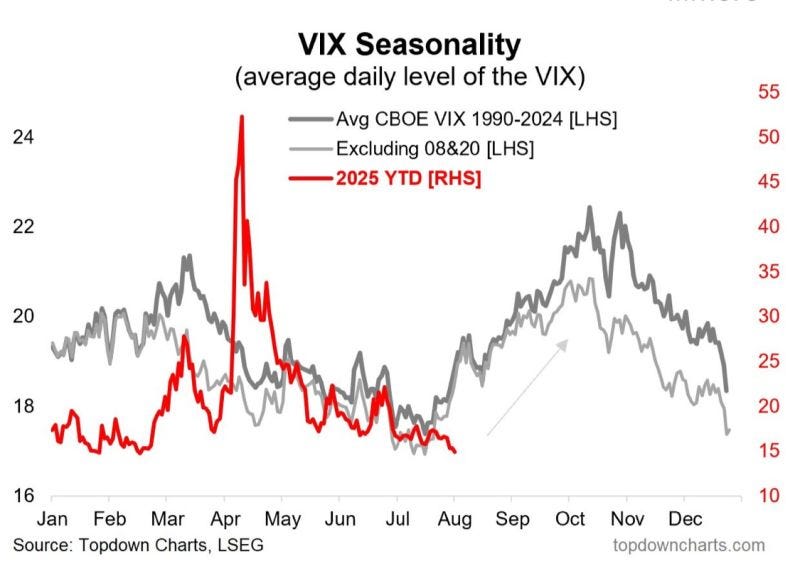
I’m preparing for that storm now, adjusting my outlook with these lessons in mind.
I encourage you to do the same.
Because moments like this – when policy shifts collide with market cycles – are where opportunities are born for those who are ready.
Let’s approach this season not with fear but with focus, armed with the knowledge that volatility, while unsettling, often paves the way for some of the most rewarding investment opportunities.