


Dear Investors,
Sometimes, when I look at these markets, I feel like I’m staring at an old photograph – one I’ve seen before.
We’ve rallied an impressive +84% since the October 2022 lows, yet only 35% of stocks are actually beating the index.
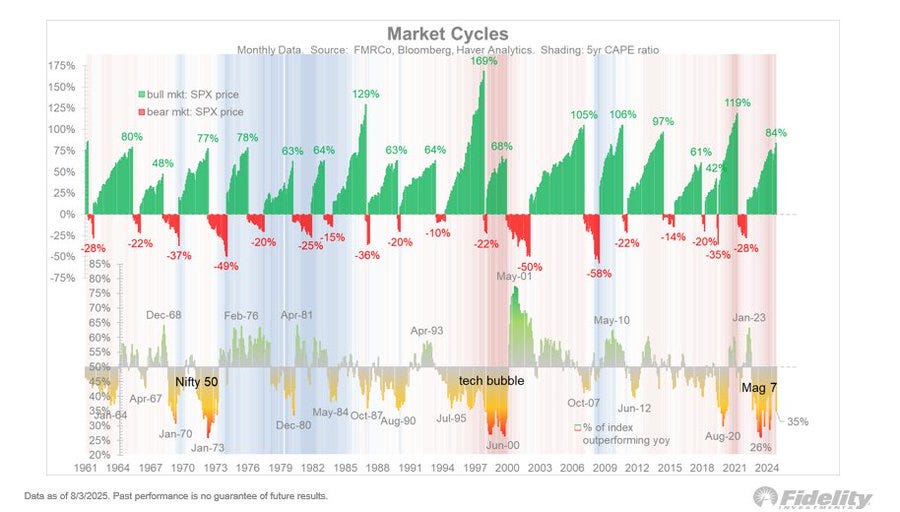
That kind of narrow leadership isn’t new.
It echoes the 1970-73 Nifty Fifty boom, when the S&P 500 climbed +77% before losing nearly half its value, and the 1998-2000 tech bubble, when the Nasdaq’s meteoric +169% surge ended in a devastating -78% collapse.
These moments taught me that rallies driven by a few giants can feel unstoppable… until they aren’t.
It’s a pattern I can’t ignore, especially when I see how enthusiasm can blindside even the most seasoned investors.
What’s striking is that during both those periods, there were plenty of warning signs – narrowing breadth, stretched valuations, and a collective willingness to overlook structural imbalances.
Today, I see those same ingredients coming together.
Valuations Speak Loudly
Let’s dig deeper into valuations.
The MSCI World IT sector trades at 27.1x forward P/E, while Growth stocks hover at 26.0x – placing them among the most expensive 10% of readings in the past two decades.
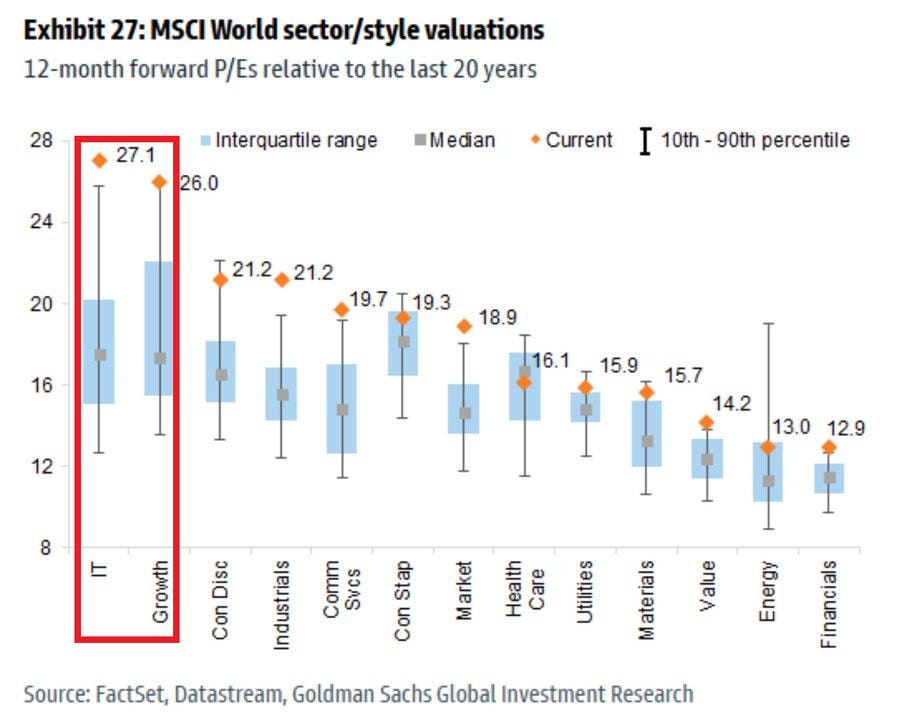
The last time we saw numbers like these was 1999, a period that taught us painful lessons about what happens when optimism outpaces fundamentals.
Five-year forward returns turned negative, averaging -2% annually, erasing years of gains for those who thought the good times would last forever.
In contrast, Energy and Financials are sitting below 13x, levels reminiscent of 2010-2011, when capital rotated aggressively, and Energy outperformed Growth by +35% over the following two years.
History doesn’t always repeat, but it often rhymes, and these spreads suggest that change may be coming for sector leadership.
The Dollar at a Crossroads
Then there’s the dollar – the heartbeat of global finance.
The DXY is clinging to long-term support near 98.7, but if it breaks – and I believe it will – we could see a meaningful -8% to -12% decline, much like in 2017 and 2020, when emerging markets responded with +15-20% gains.
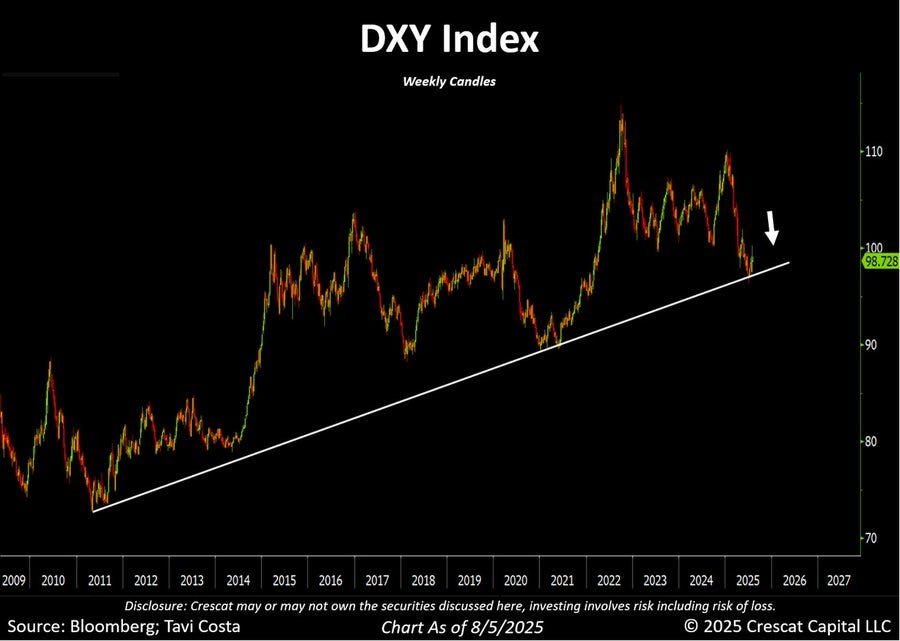
This isn’t just about charts.
The U.S. is running a twin deficit nearing 10% of GDP, a structural imbalance that historically ends with a weaker dollar.
The parallels with 1985’s Plaza Accord, when the dollar dropped -30% over two years, are impossible to ignore.
Such shifts don’t happen in a vacuum – they reshape capital flows, boost hard assets, and change the dynamics for global investors overnight.
Reading the Market Beneath the Surface
All of this is unfolding as the bond market is bracing for a pivot.
Seventy-five basis points of Fed cuts are now priced in by January 2026, suggesting reductions at three of the next four meetings.
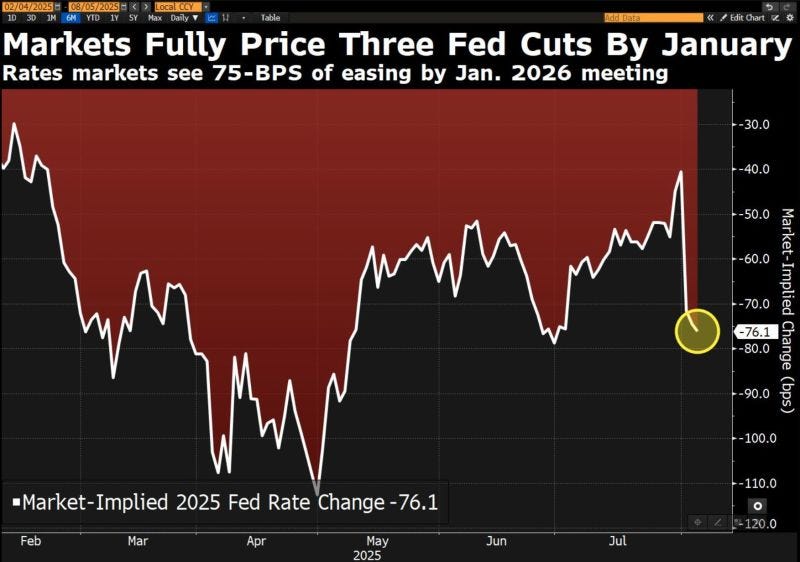
This reminds me of 2019, when similar cuts pushed 2-year Treasury yields down 90 bps, lifted the S&P 500 by +15%, and sent gold soaring +18% in a single year.
Meanwhile, sector performance is offering its own clues.
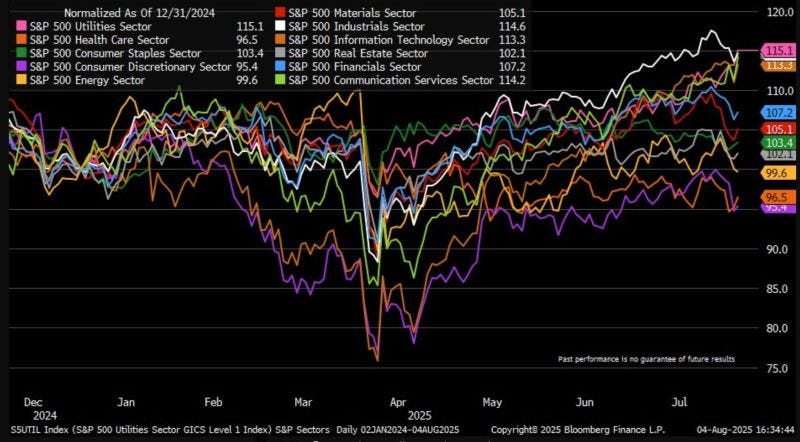
Utilities are leading YTD at +15.1%, followed by Communication Services and Technology, echoing the late-cycle behavior I observed in 2015-2016, when investors flocked to stability and yield.
But beyond the headline-grabbing performance of the Magnificent Seven, the S&P 493 is projected to grow net income by just 2-3%, falling short of inflation at 3.2% YoY.
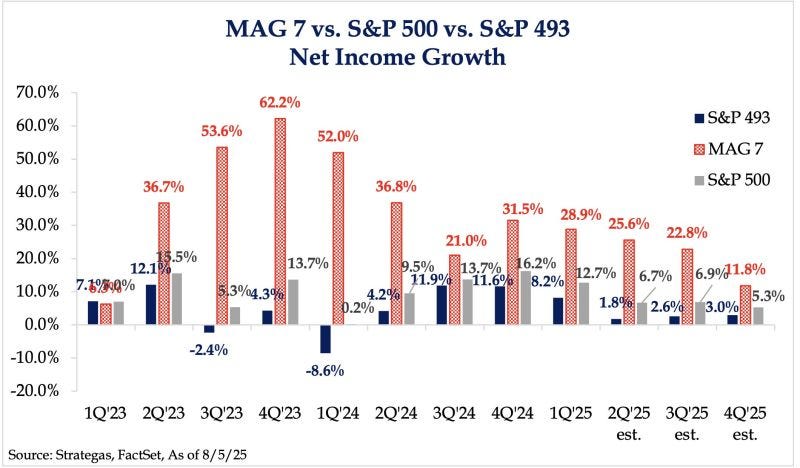
This tells me that beneath the surface, real earnings growth for most companies is stagnating.
I share all of this not to sound alarmist, but because I believe we are standing at an inflection point – one of those rare moments when data, history, and instinct converge.
For me, this means staying flexible and strategic.
I’m leaning into hard assets as a hedge against dollar weakness, watching emerging markets for the upside that could come from a DXY breakdown, and keeping a close eye on Utilities and Energy, sectors that have historically thrived when monetary easing coincides with late-cycle dynamics.
This isn’t just a market update.
It’s a call to think differently, to prepare for what lies ahead, and to turn uncertainty into opportunity – because those who adapt quickly are often the ones who thrive when the narrative shifts.