
Dear Investors,
There are moments in markets when the screen tells only a fraction of the truth.
The index may look relatively stable. The daily move may not appear dramatic enough to justify alarm.
Commentators may debate whether the latest shock is overdone, temporary, or already discounted.
And yet, beneath that surface calm, the internal machinery of the market begins to vibrate in a very different way. Liquidity becomes less forgiving. Positioning starts to matter more than narrative. Correlations shift. Safe havens behave less cleanly. Investors become more hedged, more reactive, more fragile. The price doesn’t fully reveal the tension, but the structure does.
That is where I believe we are now.
When I step back and look carefully at the charts I wanna to show with you today, I don’t see a market that is breaking apart in the classic sense.
But I do see a market that is carrying more pressure than the S&P 500 alone would suggest.
I see a world in which oil has moved violently, systematic funds have turned into mechanical sellers, the bond market is beginning to show stress under the hood, recession probabilities are climbing, and volatility across equities, rates, credit, and energy is no longer behaving like background noise.
I also see something more subtle, and perhaps more important: I see a market that is still trying to decide whether this is a temporary geopolitical shock that creates an opportunity, or the beginning of a broader cyclical repricing that will eventually force investors to reset their expectations more aggressively.
That distinction matters enormously.
One Story
So rather than treating these charts as isolated observations, I want to treat them as one story.
Not a collection of separate points, but one connected macro narrative. Because to me, they belong together. The selling by systematic funds is not separate from the oil move. The oil move is not separate from inflation risk. Inflation risk is not separate from the bond market. The bond market is not separate from recession probabilities.
I think this is exactly the kind of environment in which investors must resist the temptation to react only to headlines. They need to understand transmission, sequence, which numbers matter today, which ones matter in two weeks, and which ones matter in six to twelve months.
Most of all, they need to understand when fear is merely loud and when it is actually structural.
What I see beneath the surface of this market (recession)
The first thing I notice is that the market has lost an important source of support.
Goldman Sachs estimates that systematic funds – including CTAs, risk parity, and volatility-control strategies – have sold roughly $80 billion of global equities over the last month.
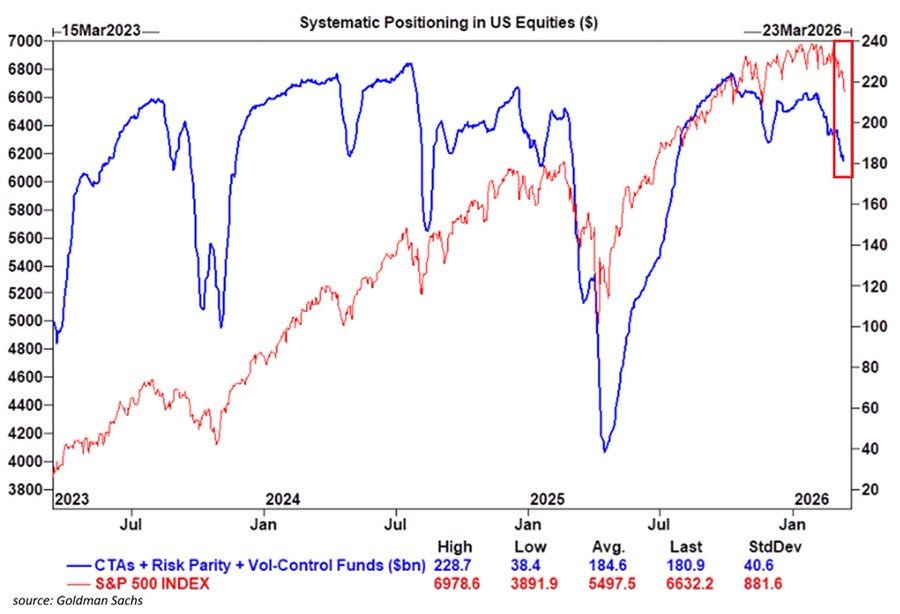
In US equities, systematic positioning has fallen to about $180.9 billion, the lowest level since July.
And according to Goldman, the adjustment is not necessarily over: another $70 billion of equity selling could arrive over the next week, and roughly $100 billion over the next month, with about $36 billion of that expected to come from the US market.
Whenever I read figures like these, I immediately change the way I interpret price action.
Because this is not a case of investors simply becoming nervous and trimming risk at the margin. This is mechanical exposure reduction. These are rule-based strategies responding to volatility, trend deterioration, and risk signals.
They are not asking whether the valuation argument still works. debating whether earnings will prove resilient. They are following a process.
And once that process turns, the market can feel much heavier than fundamentals alone would justify.
That matters because mechanical selling tends to alter the texture of the market. It creates moves that feel abrupt, air pockets that feel disproportionate.
I have seen this before
In August 2015, when market structure deteriorated and deleveraging accelerated, the S&P 500 fell roughly 11% in a matter of days. The US 10-year Treasury yield fell around 30bps over the following month as investors rushed into duration.
At the same time, USD/JPY fell from roughly 125 to 116, a decline of about 7%, as carry trades unwound. In Q4 2018, the S&P 500 lost almost 20% peak to trough, while the 10-year yield fell from 3.24% to 2.55%, nearly a 70bpsmove lower.
The historical correlation pattern is clear.
When systematic deleveraging arrives in a fragile market, equities tend to weaken, pro-cyclical currency crosses such as USD/JPY and AUD/JPY tend to soften, and duration often catches a bid in the first stage.
That is why I don’t treat FX or rates as side characters here. They are part of the same story. When the market begins to de-risk in a mechanical way, correlations often reveal it faster than equity headlines do.
But this is also where the narrative becomes more interesting.
A flush in systematic positioning is not only a source of near-term pain. It is also, paradoxically, a way of pulling forward future selling. When these strategies reduce risk quickly, part of tomorrow’s pressure is spent today.
That doesn’t mean a bottom is in place. It doesn’t mean the market is ready to rally tomorrow morning. But it does mean that some of the technical fragility is being exposed rather than hidden. And for me, that distinction matters. Markets often become more interesting when forced selling is no longer accelerating.
Then there is the geopolitical overlay
One of the charts shows the typical behavior of equities around the beginning of geopolitical events, and I think that historical pattern is essential to keep in mind.
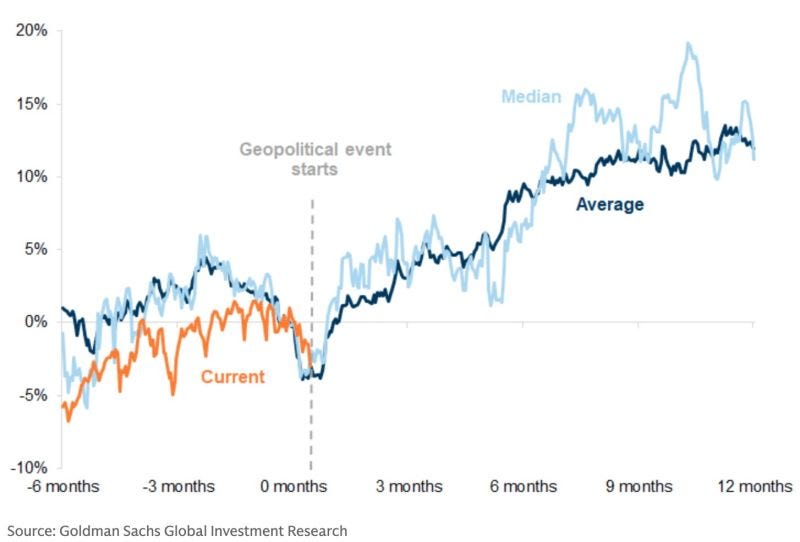
The market usually weakens around the start of the shock. The current episode is doing exactly that. Returns are still running below the long-term average and below the median historical path. That part is normal. It is the first chapter of the script: uncertainty rises, risk premia widen, investors imagine worst-case scenarios.
But what history also shows is that this first chapter is often not the whole book.
Over the following 3, 6, 9, and 12 months, markets have often recovered. The average path tends to move back into positive territory relatively quickly, and by the 12-month mark the historical profile is clearly more constructive. In several cases, the median path ends with gains in the low to mid teens.
That matters because in real time, fear always feels more permanent than it eventually proves to be.
1990 Gulf shock
The 1990 Gulf shock is still one of the clearest examples in my mind.
The S&P 500 fell roughly 16% from its summer highs into the autumn panic while oil surged sharply. At the time, the fear felt rational. But those losses were later recovered once investors realized that the shock, while serious, was not the start of a permanent collapse in earnings or financial stability.
During the 2022 Russia – Ukraine shock, Brent rose above $120, European assets suffered a much more visible blow than US assets, and EUR/USD eventually fell from around 1.14 to below 0.96. But even then, the emotional violence of the first move didn’t automatically define the full medium-term outcome.
This is why I’m always careful to separate volatility from structural trend damage.
The first one can be dramatic, unsettling, and emotionally exhausting. The second requires something more enduring: a real economic slowdown, a policy mistake, a credit accident, or a deep earnings impairment. That is not a small distinction. It is one of the most important distinctions in macro investing.
And it is also why I don’t think the current market should be interpreted with a single emotional lens. Yes, the surface is tense, the structure is under pressure, the geopolitical backdrop is serious, but seriousness alone is not yet the same thing as irreversible damage.
How the oil shock is moving through everything else (recession)
If the first part of the story is about internal market stress, the second part is about the shock that is amplifying it: oil.
One of the charts shows that crude has surged roughly 20% in 48 hours, an event that has occurred only 8 times in roughly 40 years.
That alone is extraordinary. But what matters just as much is what usually happened next.
In 7 of those 8 prior cases, the S&P 500 was higher 12 months later. The average forward return after these oil shocks was about +24%.
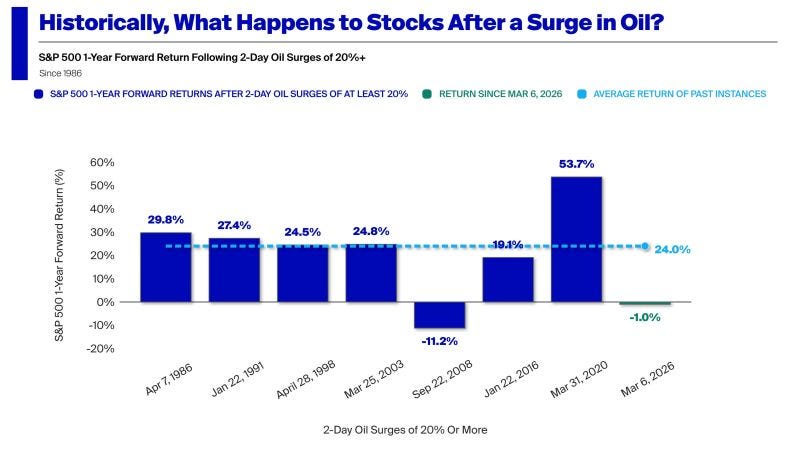
I find that number extremely important because it forces investors to resist the most seductive trap in volatile environments: the trap of assuming that a frightening move today must necessarily imply a bearish destination tomorrow.
The historical distribution here is worth repeating because it adds texture.
After the 1986 shock, the forward return was about +29.8%. 1991, around +27.4%. 1998, roughly +24.5%. 2003, approximately +24.8%. 2016, around +19.1%. 2020, the forward return surged to roughly +53.7%.
The one major negative outlier was 2008, when the S&P 500 was down about -11.2% a year later – but that was not just an oil shock. That was an oil shock colliding with a systemic credit collapse.
The current episode, which began on March 6, 2026, is still around -1.0% so far.
To me, that doesn’t say much about where the story ends. It says much more about where we are in the story: still near the beginning.
This is where I think nuance becomes essential
A violent oil move is clearly destabilizing in the short run. It damages sentiment, raises inflation fears, pressures consumer spending, complicates central-bank expectations, and increases the odds that the market will start pricing a more difficult macro path. But history also shows that these first reactions often overshoot the longer-term economic damage, especially when balance sheets remain solid, earnings prove more resilient than feared, or the oil shock fails to keep accelerating.
I also pay very close attention to the cross-asset fingerprints that accompany these moves.
In the first phase of an oil shock, energy equities usually outperform the broader market.
Breakeven inflation often rises faster than real yields. Commodity-linked currencies such as CAD and at times NOK often hold up better than currencies tied to major importing economies.
In other words, oil doesn’t move alone. It drags a whole set of relative trades with it. And those relative moves tell me whether the shock is staying compartmentalized or starting to infect the broader macro regime.
But this time there is another layer, and it is one I find especially important.
Global oil market
The global oil market no longer appears to be functioning as one unified market. It appears to be splitting into two.
According to the material you shared, Asia is effectively paying much higher prices – in some discussions above $150 per barrel – while the US and parts of the West are facing a much lower range, roughly $95 to $105.
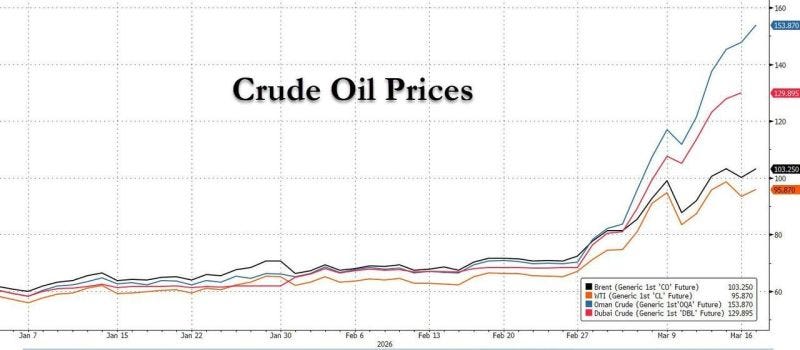
That isn’t a normal commodity move. That is fragmentation. That is a geopolitical fracture showing up directly inside the energy market.
And once that kind of fragmentation occurs, the macro consequences become highly uneven.
If one region is paying 40% to 60% more for energy than another, industrial profitability, consumer strain, and policy vulnerability are not going to evolve in parallel.
Import-dependent Asian economies are more exposed to margin compression, weaker industrial activity, and early signs of demand destruction.
Economies with stronger domestic production or better buffers can absorb the shock more effectively, at least for a time. That means regional equity performance, bond behavior, and currency moves begin to diverge much more sharply.
European energy shock
I think the 2022 European energy shock remains the best recent comparison.
Europe absorbed a far more acute imported energy shock than the US. EUR/USD fell roughly 16% from the 1.15 area to below 0.96. European cyclicals underperformed. And bond yields didn’t behave in the comfortable old way because inflation premia remained elevated even as growth deteriorated.
That is the correlation message I take from a fragmented energy market: regional equities stop trading like one uniform risk bucket, FX becomes a direct expression of energy vulnerability, and bonds can remain under pressure even in softer growth conditions if the inflation impulse stays alive.
That is why I find it increasingly difficult to think in broad, generic terms right now. Once oil stops being one market, equities stop being one story.
And then there is the geopolitical premium itself.
Bloomberg Economics
Bloomberg Economics estimates that roughly one-third of the recent move in oil can be attributed directly to the Iran war and the geopolitical risk premium.
That estimate matters because it tells me that a meaningful portion of the oil rally is not simply about conventional supply and demand. It is about fear, shipping routes, strategic choke points, and political leverage.
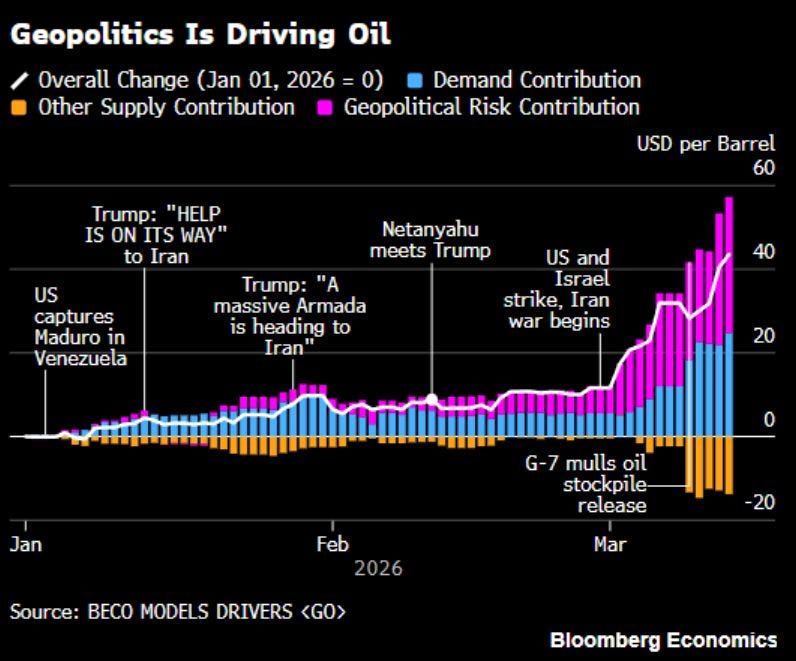
When I frame it that way, crude stops being just a commodity and becomes something else: a transmission mechanism for geopolitical risk.
The comparison that comes to mind is the 2019 Abqaiq attack, when oil spiked dramatically in a single session, safe havens responded instantly, and then part of the move faded as the market reassessed the persistence of the disruption.
In that sort of environment, price action becomes extremely headline-sensitive.
Oil and gold
Oil and gold often rise together. EM FX, airline stocks, transport names, and rate-cut expectations tend to suffer. A single diplomatic development can move crude by 5% to 10% quickly, which then ripples through inflation expectations, bond yields, and equity multiples.
That is why I think investors should stop asking whether oil is simply “high” and start asking what kind of oil move this really is.
Is it a growth move? No.
Is it a classic cyclical supply/demand move? Not really.
It is, at least in meaningful part, a geopolitical move. And geopolitical premia are powerful, but they are also unstable.
Energy Food
Then comes the next stage of transmission: energy into food.
The chart linking gasoline prices and food prices is one of the most quietly consequential in the whole set.
Gasoline has continued to climb, while food prices have not yet fully followed.
Energy often moves first and food follows later. If that lagged relationship holds again, what currently appears to be an energy shock may evolve into a broader cost-of-living shock over the coming months.
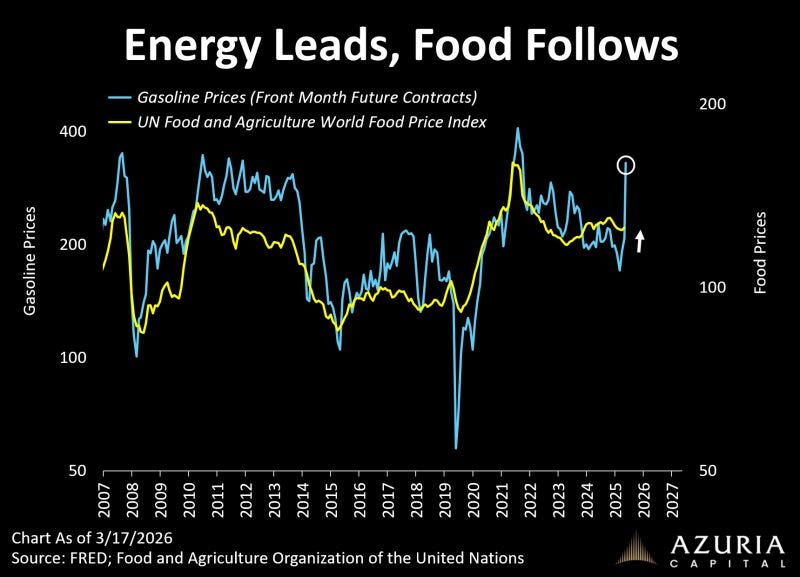
This is exactly how second-round inflation begins.
The 2021-2022 cycle is still the clearest reminder. Energy moved first. Food followed. And what began as a commodity story became a broad inflation regime.
US CPI moved from around 1.4% in early 2021 to 9.1% by June 2022. The US 2-year yield rose from roughly 0.15% to above 3% in a relatively short time and later moved toward 5% in the tightening cycle.
Over that same broad period, the S&P 500 experienced a peak to trough drawdown of nearly 25% in 2022, while EUR/USD fell from around 1.13 toward 0.95 as the dollar absorbed both policy divergence and global growth anxiety.
Energy prices
That historical chain still matters enormously to me. Higher energy means higher transportation and input costs. Those costs can feed into food and broader consumer prices. Inflation becomes stickier. Front-end rates reprice. Equity multiples come under pressure.
This is why I remain deeply skeptical whenever policymakers or investors lean too heavily on the word transitory.
Markets accepted that word too quickly once before, and the repricing that followed was brutal. It is one thing for inflation to fall from 9% to 3%. It is something very different for it to start re-accelerating from 3% toward 4% or higher because energy and food refuse to normalize.
That distinction changes everything: rates, currencies, multiples, portfolio construction, and central-bank expectations.
Why the bond market matters more than most investors realize (recession)
If oil is the visible shock, the bond market is the hidden vulnerability.
This is the part of the story I’m watching most closely, because when the bond market begins to behave in a disorderly way, the entire macro system becomes more fragile.
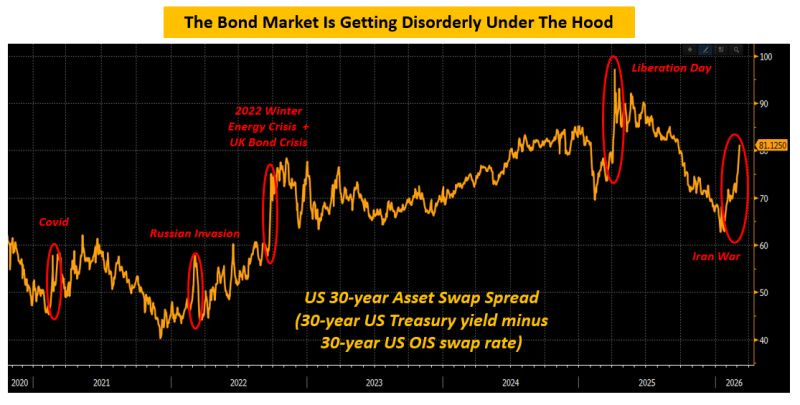
One of the charts highlights stress in the US 30-year asset swap spread, and I think that is a crucial signal.
It points to the unwinding of highly leveraged bond-market trades, particularly swap spread and basis-style positions that rely on repo financing and substantial leverage.
These trades can look calm and profitable for long stretches of time, and then become extremely unstable once volatility rises, funding becomes less forgiving, or margin calls begin to spread.
What worries me is not simply the existence of those trades.
It is the combination of those trades with a market already facing rising Treasury supply, constrained dealer balance sheets, and a macro backdrop in which investors may be forced to sell what they can, not just what they want.
Treasuries are not just another market. They are collateral, benchmark, hedge, discount rate, and funding instrument all at once. So when I start to see signs that Treasury-market plumbing is less orderly than it should be, I pay attention immediately.
History gives us enough warnings here
In March 2020, the S&P 500 fell roughly 34%, the DXY surged about 8% in a matter of days, and even Treasuries briefly stopped behaving like a clean safe haven because forced liquidation overwhelmed normal market logic until the Fed intervened.
During the UK LDI crisis of 2022, 30-year gilt yields jumped by more than 100bpsin days, not because the economy was booming, but because leverage and collateral stress had taken over the pricing mechanism.
That is the correlation risk I care about most right now. If the bond market stops behaving like a stabilizer, then stock-bond correlation can turn positive, financial conditions can tighten abruptly, and the dollar often strengthens because liquidity itself becomes scarce.
This is also where the oil story loops back into rates in a way that I find especially uncomfortable.
If governments respond to higher fuel prices with subsidies, fiscal support, or other emergency measures, that likely means more issuance. More issuance into a market that is already showing structural fragility is not a small complication.
It becomes part of the central macro risk.
Markets can often survive higher oil. They can sometimes survive geopolitical fear. What they struggle to survive smoothly is an energy shock that begins to destabilize the structure of the bond market underneath everything else.
And then we reach the recession question.
Recession
Moody’s recession model now places the probability of a US recession over the next 12 months at 48.6%, the highest reading since the 2020 pandemic and roughly 15 percentage points higher than it was six months ago.
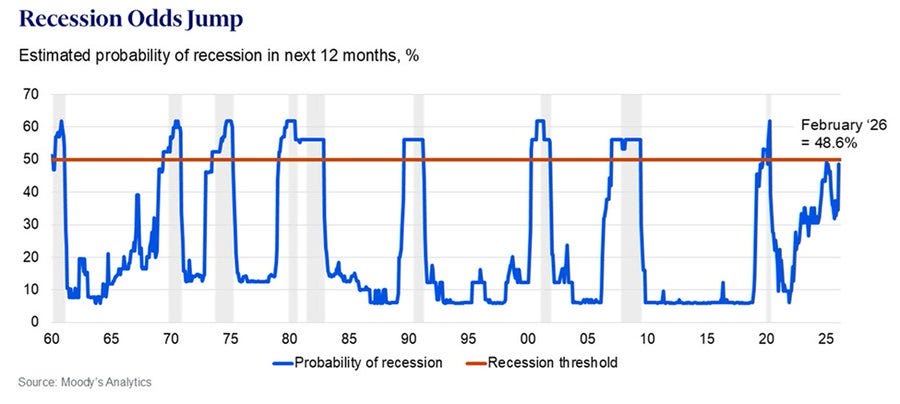
I don’t treat that as just an interesting chart. I treat it as evidence that the economy entered this oil shock with less margin for error than many investors may still assume.
When recession probabilities move close to or above 50%, market behavior starts to change in very recognizable ways. Equity multiples compress. High-yield spreads often widen by 150 to 300bps.
If a recession truly materializes, the US 10-year yield has historically tended to fall by roughly 75 to 150bps over the following 6 to 12 months as growth slows and markets begin pricing a more aggressive policy response.
Dollar
In FX, the dollar often strengthens first because of liquidity and funding stress, only later giving back some of that strength when the Fed moves more decisively toward easing.
That is why I think the next 30 to 60 days are so important. The economy was already softening at the margins before the latest oil shock. The labor market was no longer as robust as it had been.
Broader data had begun to lose some momentum. Now add persistent oil above $100, the possibility of food inflation following energy, and stress in bond-market plumbing, and suddenly the threshold between “temporary event shock” and “broader cyclical problem” becomes much thinner.
If oil stays elevated and real disposable income weakens while financial conditions tighten, recession probability may not just flirt with 50%. It may move through it. And if that happens, the market may stop treating this episode as a geopolitical scare and begin repricing it as a genuine cyclical slowdown.
That transition, if it occurs, will matter much more than the headlines.
What all of this means for investors now (recession)
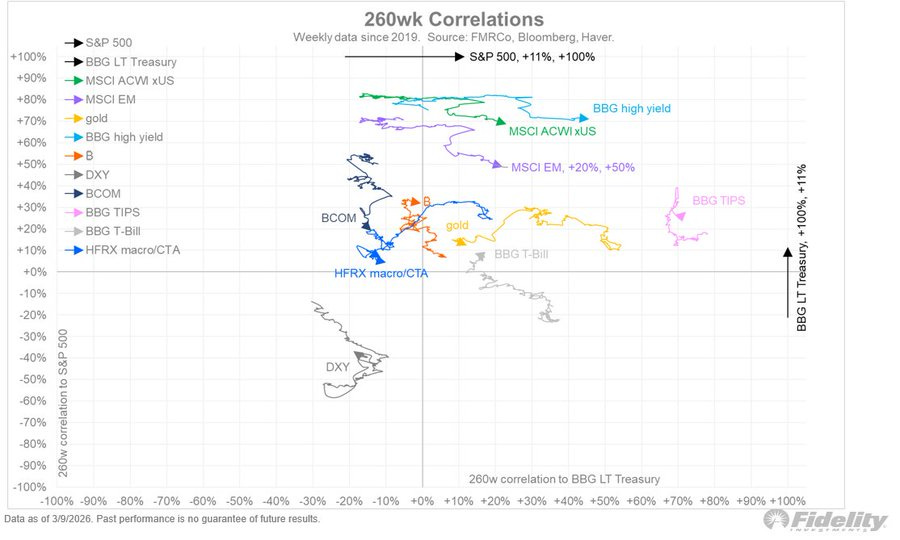
One of the charts from Fidelity is especially valuable because it reminds me that diversification only matters if it behaves differently when stress arrives.
The chart shows that equities have become somewhat more correlated with long-duration bonds, while the assets that have remained more effective diversifiers are things like managed futures, commodities, gold, and in some cases Bitcoin.
I think the cleanest recent illustration of that regime shift was 2022.
The S&P 500 fell about -18%, while long-duration Treasury proxies did even worse in many cases, falling roughly -25% to -30%.
Broad commodities, by contrast, delivered positive double-digit returns, and managed futures were among the few strategies that actually benefited from the trending environment across rates, FX, and commodities.
That lesson is incredibly relevant right now
When inflation volatility rises, traditional stock-bond diversification becomes less reliable.
I think that is exactly the kind of lesson investors need to internalize in this environment.
They don’t need to become permanently bearish, to predict every daily move. But they do need to recognize that portfolio construction becomes much more important when inflation, geopolitics, and bond fragility begin interacting at the same time.
And that brings me to the final paradox, the one that sits at the center of everything.
Despite all of this stress, the S&P 500 is still only around 4% below all-time highs.
The VIX futures curve has moved into a stress zone.
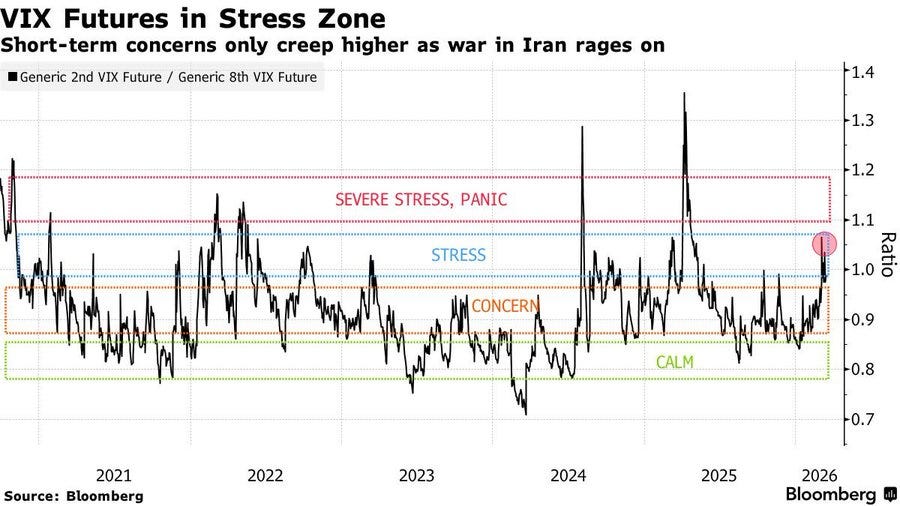
Wall Street is heavily hedged. Volatility across equities, bonds, oil, and credit has risen sharply, almost back to the levels seen during the April sell-off. And yet the index itself has not broken decisively.
Why?
Because in my view, the market is still balancing two truths that have not yet fully resolved.
The bearish truth is obvious. Oil is higher. Recession risk is rising. The bond market is showing stress beneath the surface. Systematic funds are selling. Macro visibility is deteriorating.
But the constructive truth is also real. Earnings haven’t collapsed. Corporate balance sheets remain relatively solid. Broad fundamentals are weakening at the margin, but they are not yet screaming deep bear market. And history still argues that geopolitical shocks, by themselves, often create opportunities rather than lasting destruction.
There is also the positioning element. When investors are already heavily hedged, markets can often absorb bad news for longer than many expect, because a great deal of protection has already been bought. In past episodes when volatility rose faster than the spot index declined, equities often required an additional catalyst – a sharper growth scare, a credit accident, or a policy mistake – before a more decisive second leg lower could begin.
So I don’t think this market is complacent.
I think it is unresolved.
It is still trying to determine whether this is an event-driven correction that will eventually clear, or the early stage of a more consequential cyclical repricing.
My own base case, at least for now, is that the immediate environment remains difficult and probably more fragile than the index level suggests. Over the next 2 to 3 weeks, I wouldn’t be surprised to see another retest lower in equities, especially if oil remains above $100 and bond-market stress intensifies. In that sort of move, I would expect cyclicals to underperform defensives, USD/JPY and AUD/JPY to stay soft, and the front end of the rates curve to remain torn between inflation fear and growth fear.
But I’d also be very careful about becoming structurally bearish too quickly.
Unless oil makes a sustained move toward $120-$130, labor-market deterioration becomes much more visible, or Treasury-market plumbing becomes materially more disorderly, the medium-term evidence still looks more consistent with temporary weakness than with a classic bear market.
If crude stabilizes near $100-$105, geopolitical tensions cool somewhat, and the bond market holds together, the next 6 to 12 months could still resemble the more familiar post-shock pattern: messy adjustment first, then recovery in equities, narrower credit spreads, and more selective leadership from quality balance sheets, cash-generative businesses, and real-asset exposure.
If the opposite happens – if oil moves decisively above $120, recession probability breaches 50%, and rates markets become more disorderly – then I would expect a much harsher repricing: lower equities, wider spreads, a firmer dollar, and eventually lower long-end yields once growth concerns begin to dominate.