


Dear Investors,
It was almost 2 a.m. last Sunday when I closed the last spreadsheet.
And on my screen sat a number that, by every rule I’ve learned in markets, should have made me smile.
0.68.
The last time it was this low, banks were failing and the S&P 500 had lost more than half its value.
Today the index sits near record highs.
I didn’t smile.
Climbers say the summit is optional, getting down is mandatory.
So I stopped staring at the peak, and I started studying the weather.
That’s when I found the other pieces.
A bond market that refuses to calm down.
A corner of credit that started cracking last week, exactly where the AI money is borrowed.
A country quietly shipping its gold abroad at a pace no one alive has ever seen.
And an inflation chart that looks, line by line, like a year I hoped I’d only meet in history books.
Alone, each is a curiosity.
Together, they form a question I couldn’t shake all week.
What if the cheapest stock market in a decade is cheap for a reason?
So I dug through the archives, chart by chart.
What I found unsettled me.
In every episode, the ending wasn’t written by the stock market.
It was written by something most equity investors never look at.
And in just 10 days, that something has a date on the calendar.
1 morning in Washington that could send this market down 1 of 2 very different paths.
I’ll show you both paths.
I’ll show you which one history favors.
And the pencil line on my screen that tells me which one we’re on.
But not in the first 3 charts.
The first 3 are the good news, and they are real.
But each hides a footnote I can only explain in the PRO section, at chart 4.
That’s where the sunshine meets the storm front.
And that’s where I’ll tell you what kept me awake.
Let’s start at base camp.
With a napkin.
🧮 PEG 0.68 - Lynch would be buying the whole index
Peter Lynch had a rule simple enough to scribble on a napkin.
“If the P/E ratio is less than the growth rate, you may have found yourself a bargain.”
He meant it for a single stock. I ran it on the whole index.
It passed, by the widest margin in 30 years.
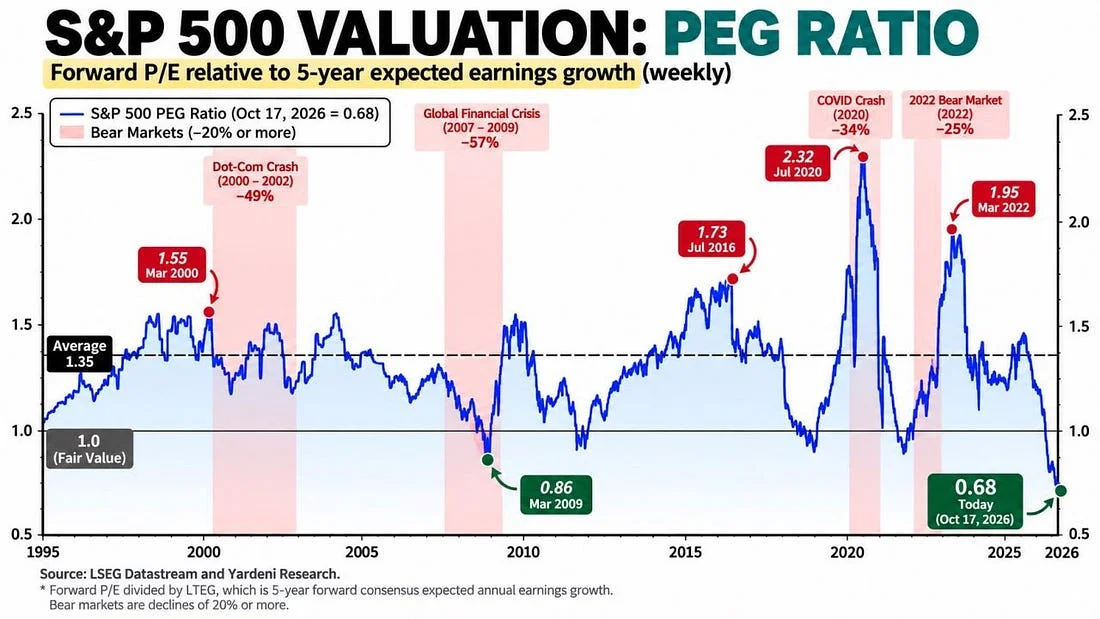
The PEG divides the forward P/E by expected 5Y earnings growth. A reading of 1.0 is fair value, and the 30-year average is 1.35.
Today: 0.68.
I still remember March 2009.
The S&P was down 57%, nobody wanted to own a single share, and the PEG touched 0.86.
We are 21% below that level today, with the index near its highs.
At the COVID frenzy of July 2020, it hit 2.32. In March 2022, just before the bear market, it still read 1.95.
So what happened the last times it slipped below 1.0?
After March 2009, the S&P rose 69% in 12 months, from 677 to about 1,140. The 10Y climbed from 2.9% to 3.7%, and the dollar index slid about 10%, from 89 to 80.
After December 2018, the index gained 38%, from 2,351 to about 3,240. The 10Y fell from 2.8% to 1.9%, and USD/JPY barely moved from 110.
After October 2022, it rose 21%, from 3,577 to about 4,330, even as the 10Y went from 4.0% to 4.9%. The dollar index was 6% lower, from 113 to 106.
3 episodes.
3 double-digit gains.
Read them again, as I did at 2 a.m.
The biggest rebound came when the dollar fell the most.
Put that in your backpack. It returns in the PRO section with a name and a date.
Because a ratio has 2 sides, and only 1 of them is a price.
The denominator is the consensus growth forecast, and analysts have always been incurable optimists.
With prices unchanged, growth expectations would need to be cut by 32% to bring the PEG back to 1.0, and by roughly 50% to return to the 1.35 average.
If the forecasts are right, the S&P would need to almost double, +98%, just to return to average.
The truth lies in between. What comforts me is the direction.
The PEG isn’t falling because prices are collapsing.
It’s falling because growth expectations are rising faster than prices.
Which is exactly what the next chart shows.
📈 EPS +30%. P/E -13%. The multiplication that explains everything
When friends say “bubble”, I ask them to split the rally in 2: what earnings delivered, and what investors paid.
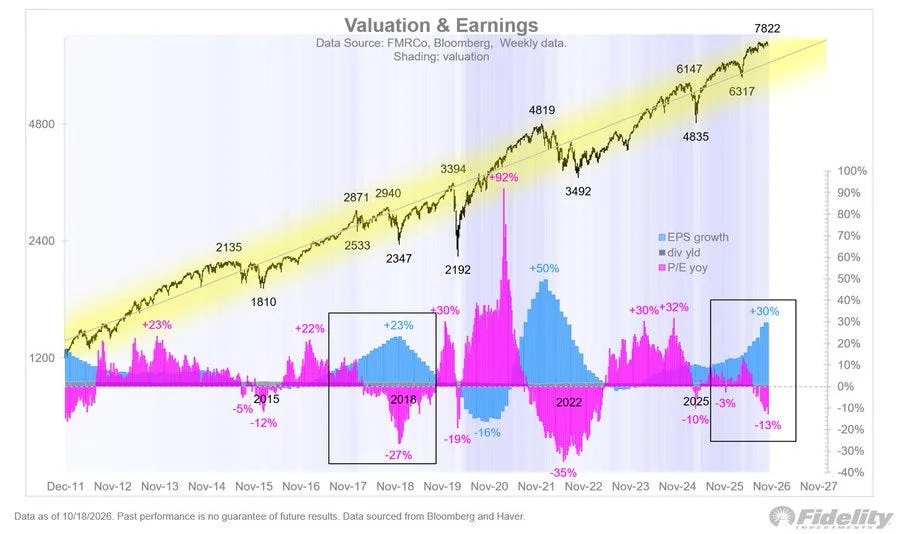
On this chart, the blue bars are earnings growth. The pink bars are the change in the P/E.
Right now, earnings are up 30%, while the P/E is 13% lower Y/Y.
The S&P stands at 7,822.
Multiply the 2 together, 1.30 x 0.87, and you get 1.13.
A gain of about 13%, driven entirely by profits, while the market got cheaper.
Bubbles are made of pink bars. This one is painted blue.
The chart circles 2 earlier moments. Their contrast is the key lesson of this letter.
In 2018, earnings grew 23% while the P/E compressed 27%.
I remember that Christmas well.
In Q4, with the Fed still hiking, the S&P fell 20%, from 2,940 to 2,351. The 10Y had peaked at 3.24%, the dollar index sat flat near 96-97, and EUR/USD drifted from 1.15 to 1.12.
On January 3, 2019, USD/JPY flash-crashed to 104.9.
Then the Fed blinked.
The 10Y fell to 1.9%, and 2019 delivered +29%.
In 2022, the story was different.
Valuations collapsed by 35%, and the S&P lost 25%, from 4,796 to 3,577.
But look at the weather around it. The 10Y went from 1.5% to 4.25%. The dollar index rose 19%, from 96 to 114. EUR/USD broke parity, from 1.14 to 0.96, and USD/JPY flew from 115 to 152.
Same divergence.
2 opposite endings.
When yields fell, compression ended in a +29% year.
When yields rose 275 bp and the dollar soared 19%, it ended in a bear market.
The bond market chose the ending, both times.
Which leaves me with the question I’ll answer at chart 4: what is the bond market saying now?
I’ll give you a hint.
It isn’t whispering.
From the 4,835 low of April 2025, the S&P is up about 62%, and from 6,317 about 24%.
Every step paid for in profits. And the calendar is on its side.
🗳️ The midterm low - 100% hit rate, +17% on average
Since 1900, US stocks have moved around the 4-year presidential cycle like a tide.
The midterm year is the low tide, usually bottoming in Q4, right around the elections.
This year, Americans vote on November 3.
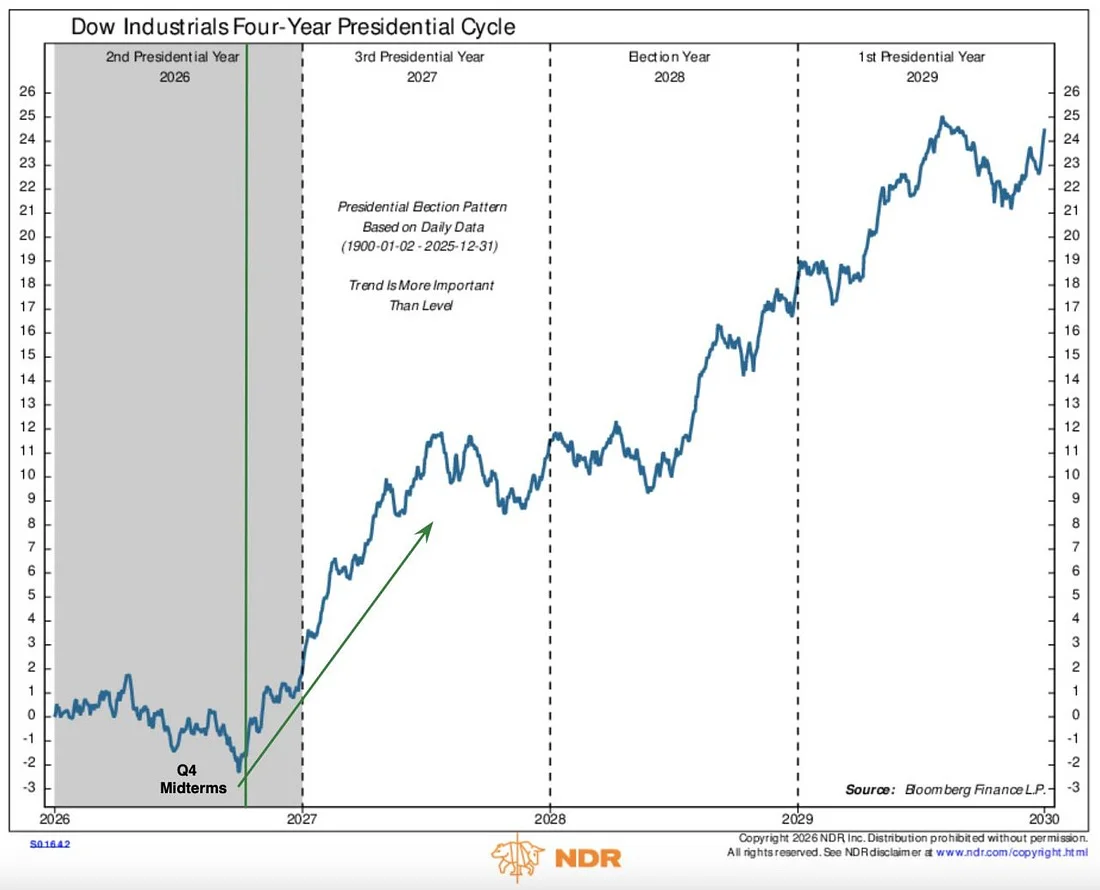
From that low through Q2 of the pre-election year, the market has gained about 17% on average, with a 100% hit rate.
Applied to 7,822, that’s roughly 9,150 by mid-2027.
Beneath the surface of the last 4 windows:
In 2010, the S&P climbed 33%, from 1,022 to 1,363. The 10Y edged from 3.0% to 3.3%, and EUR/USD rose 24%, from 1.19 to 1.48.
In 2014, the gain was only 14%, from 1,862 to 2,130. The 10Y stayed stuck at 2.2%, while USD/JPY surged from 106 to 124, crushing the yen by 15%.
In 2018, the index rose 25%, from 2,351 to 2,942, as the 10Y fell from 2.8% to 2.0% and the dollar went nowhere.
In 2022, it gained 28%, from 3,577 to 4,589, with the 10Y flat at 4.0% and the dollar index down 11%, from 113 to 101.
The 2 strongest windows came with a falling dollar.
The weakest came with a dollar rally.
The cycle sets the direction. The dollar decides the distance.
So here I’m with 3 green lights.
And 3 footnotes.
3 charts about stocks, and none of them is really about stocks.
They all point to the same place: the bond market, and the dollar that moves with it.
The election on November 3 may not be the most important event of that week.
The morning after could be.
A Treasury announcement most investors have never read, which in 2023 moved markets more than any Fed meeting that year.
In the PRO section, I’ll show you that morning in 2023, the opposite path of 1994, the number that tells me which script we’re living, and why gold and inflation worry me more than anything this year.
Everything up to here is what the market wants you to see.
Everything below is what it’s not telling you.