


Dear Investors,
It’s Saturday afternoon, and I’ve waited 48 hours before writing to you.
On Thursday evening, after the close, I did something I rarely do. I stayed alone with my screens until late.
Everyone around me was talking about the same number. I kept staring at a much smaller one, hidden in a corner of the market where nobody was looking.
The big number you already know.
On November 5, 2026, $2.8 trillion of US market value disappeared in a single session. It’s the largest one-day loss in dollar terms ever recorded. The previous record, $2.69 trillion, belonged to the COVID crash of March 2020. The Nasdaq 100 closed -6.36%.
Dollar records impress me less than they impress social media, because the market is so much bigger today.
On March 16, 2020, the Nasdaq lost -12.19%, twice as much as Thursday. If this were only a matter of size, I’d be writing to you with a very different tone.
What kept me awake was the combination.
Earnings are being revised up at the fastest pace in years, and yet multiples are collapsing. The Fed keeps raising rates into a market that’s starting to crack.
The credit spreads of the companies building the AI infrastructure are moving the way I’ve seen them move only once before, in a period many of you remember well.
And on Thursday, while the Nasdaq was falling 6%, one small group of stocks quietly went the other way. In 40 years, that has happened only 11 times.
I’d like you to carry one question with you until the last line of this letter.
What if Thursday wasn’t the event, but the warning that comes before it?
In the first part I’ll walk you through three charts that tell us where we are. They are the backdrop.
The real answer, what history says usually comes next, where I believe capital is about to move and what all of this means for those of us, lives in the PRO section.
This is one of those letters where the second half is worth far more than the first.
🫧 From 7.1% to 16.2%
For years I’ve told you that price analogs are a parlor game.
And yet this one, built by Jurrien Timmer at Fidelity, refuses to break. I stopped pretending not to see it.
Timmer overlays the real S&P 500 of 1994-2002 on today’s market. He aligns the April 2025 tariff tantrum with the October 1998 low that followed the LTCM crisis.
From that low to the March 2000 peak, the S&P 500 gained about 65% and the Nasdaq about 250%, in just 17 months.
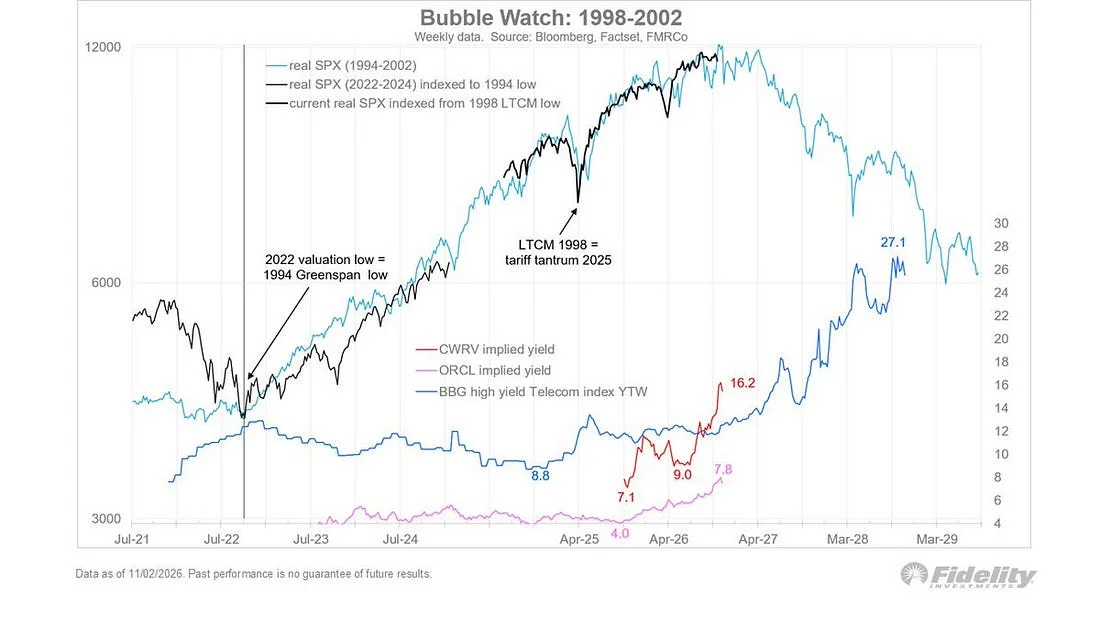
The AI rally that began in April 2025 has moved on the same clock and with the same slope. Today the black line sits exactly where the blue one was in early 2000. Right on the summit.
The price line, though, isn’t what worries me.
My eyes keep going to the bottom of the chart, where credit lives. The implied yield on CoreWeave debt has climbed from 7.1% to 9.0% and is now at 16.2%. Oracle’s has nearly doubled, from 4.0% to 7.8%.
Right beside them, Timmer draws the Bloomberg high-yield telecom index of 2000-2002. It went from 8.8% all the way to 27.1%.
Back then, the telecom carriers were borrowing heavily to build the internet dream. Their bonds started to crack while the Nasdaq was still near its highs, and almost nobody in the equity world paid attention.
From March 2000 to October 2002, the S&P 500 slid from 1,527 to 777, a loss of 49%. The Nasdaq Composite went from 5,048 to 1,114, a loss of 78%.
The final equity bottom arrived in October 2002, the very same month in which high-yield spreads reached their peak. Credit had shown the way down, and it showed the way out too.
Today CoreWeave’s 16.2% is already above the 12-13% or so that the telecom index showed at the March 2000 peak.
If I had to name the telecom carriers of this cycle, I’d name the neoclouds.
Then there’s the Fed.
The October jobs report beat expectations by 100,000 jobs, and markets now see an 80% chance of another 25 bp hike on December 9. The Fed already moved in September, bringing the upper bound back to 4.00%.
In 1999-2000, Greenspan hiked 6 times, from 4.75% to 6.50%. The bubble peaked right in the middle of that cycle, long before it ended.
A rate hike never kills a bubble on the day it happens. It slowly chokes the most indebted borrowers first.
One detail of that period saved many portfolios.
While stocks were halving, the US 10Y yield fell from 6.8% to 3.6%, and the Fed funds rate dropped from 6.50% to 1.25%. Bonds acted as a shield.
I’m far from sure they can play that role this time. In the PRO section I explain why, because it changes the way a portfolio should be built today.
📉 EPS +32%, P/E -50%
I think this is the most counterintuitive table I’ve seen all year.
Since June 30, forward earnings estimates for memory makers have risen 32%. Over the same months their P/E has fallen from 10.5x to 5.3x, a 50% collapse, and their market value is down 33%.
The AI infrastructure names tell the same story. Estimates are up 31%, the P/E went from 21.8x to 13.9x, and market cap is down 17%.
Semiconductors follow closely. Estimates up 30%, multiple from 21.1x to 13.8x, market cap down 15%.
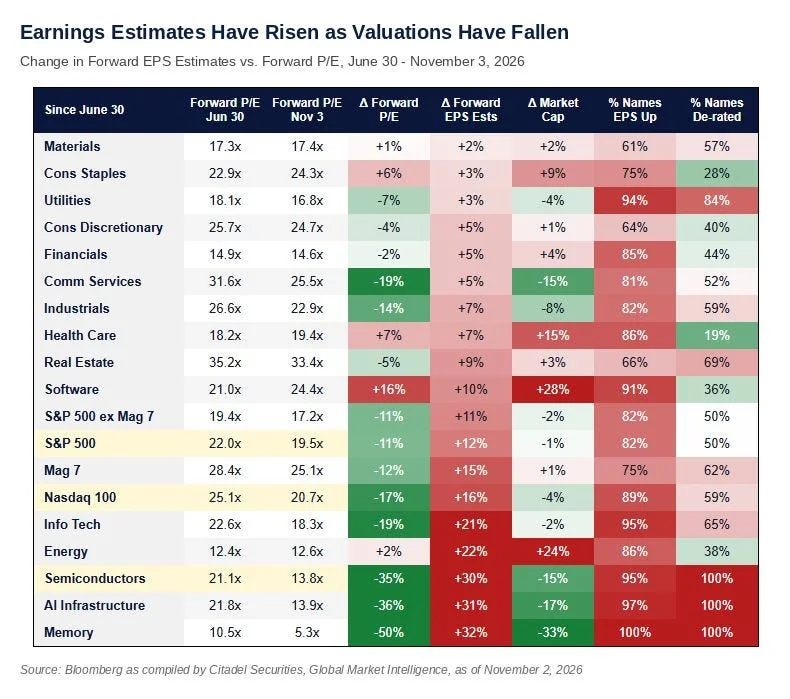
All 20 semiconductor names in the S&P 500 have de-rated.
For the S&P 500 as a whole, estimates are up 12%, the P/E has dropped from 22.0x to 19.5x, and the market cap has barely moved, at -1%.
On the opposite side, Software is the only group whose multiple has expanded, from 21.0x to 24.4x, with a market cap up 28%. Consumer Staples now trade at 24.3x.
Companies growing their earnings by 3% are valued at almost twice the multiple of semiconductor companies growing theirs by 30%.
The market isn’t paying for this year’s profits. It’s paying for how long they’ll last.
When cyclical earnings reach a record, investors start pricing the year in which they’ll fall.
Memory is the textbook case. In 2018, Micron was trading at roughly 4x forward earnings and lost 56% between May and December, while analysts were still raising their numbers.
Fiscal 2019 EPS then fell 47%. And yet in 2019 the stock gained 69%, as soon as investors could see the bottom of the cycle.
History offers 3 moments very similar to this one. In 2000, S&P 500 earnings grew 9% and the index lost 10%. In 2018, earnings grew 21% and the index lost 6%. In 2022, earnings grew 5% and the index lost 19%.
The setup was nearly identical every time. The outcomes couldn’t have been more different.
After 2018, the market gained 29%. After 2022, it gained 24%. After 2000, it lost another 13%, because the following year earnings fell 31%.
On its own, the de-rating tells us little. Next year’s earnings will tell us everything.
The question I keep asking myself isn’t whether the market is cheap. It’s which of those three years we’re living in.
In the PRO section I go through the earnings math for 2026 and 2027, and 4 precise scenarios for the index, together with the numbers that would push us toward 2019 or toward 2001.
🗳️ $1 became $10,000+
Every election season brings back the same prophecy.
This week it sounded like “the market will crash when Democrats are elected”, and when Thursday arrived, social media felt it had its proof.
I prefer to answer with this chart.
One dollar invested in US stocks in 1926 had become more than $10,000 by 2025, roughly 10% a year, across 17 presidents of both parties.
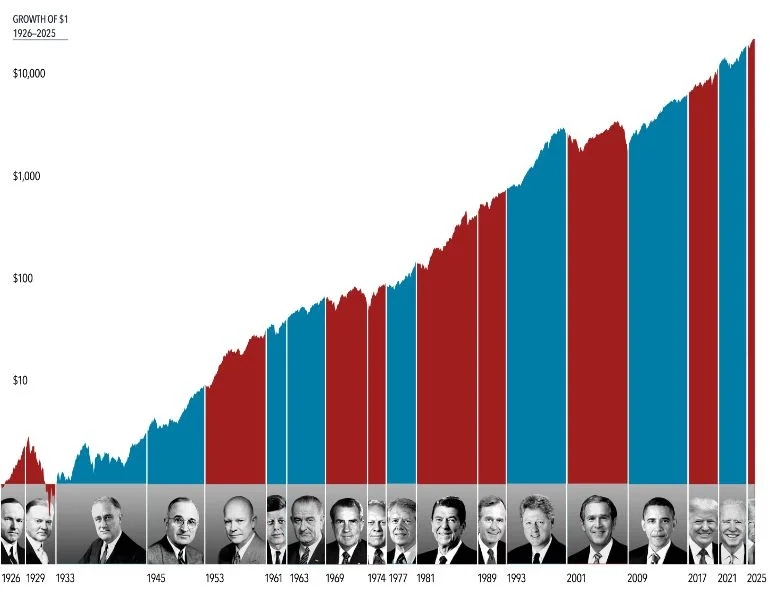
Even the great bear markets are shared fairly between the two colors. 1929-1932 under Hoover, 1973-1974 under Nixon and Ford, 2000-2002 and 2008 under Bush, 2020 under Trump, 2022 under Biden.
Every time, the real causes were valuations, rates, credit and earnings. Never the color of the White House.
The calendar even offers a small argument for patience.
In the 12 months after the most recent midterms, the S&P 500 gained about 4% after 2010, 4% after 2014, 12% after 2018 and 14% after 2022.
According to Advisor Perspectives, in the 6 months following a midterm election the index has averaged +12.4%, and all 13 cycles in their sample ended positive.
Whatever the final count once every race is called, the uncertainty of the vote is now behind us.
But a friendly calendar didn’t protect anyone in 2002. Politics makes noise. The signal that matters appeared on Thursday somewhere else.
In a place that has nothing to do with Washington, and a great deal to do with what happened in 2000 and in March 2020.
That place is where the PRO section begins.