


Dear Investors,
There’s a moment, in every cycle, when the numbers stop arguing with each other.
They don’t shout.
They line up, like climbers roped together on a ridge.
I felt that moment on Tuesday night.
I was reading the Fed minutes for the 3rd time.
19 out of 19 officials voted to hike. Unanimous.
And yet, 2 pages later, I found them split on the reason.
That alone wouldn’t have kept me awake.
What kept me awake was my second monitor.
3 charts on it were telling the same story from 3 different angles. A credit market. A liquidity gauge. And a spread between 2 interest rates that, the last time it looked like this, preceded the first 75 bp hike since 1994.
None of them made the headlines.
All of them point to the same window on the calendar.
I’ll tell you which window. Just not yet.
First, the good news, and I mean it.
On Monday, this bull market turns 4. Over 50 years, only 5 bulls lived this long, and every one of them made it to its 5th birthday.
Then the uncomfortable part: none of them died of old age.
4 of the 5 died of the same thing.
The first 3 charts are the map: a strong bull, a world turning its back on America, and central banks hoarding gold as if they knew something we don’t.
The real analysis starts at chart 4, in the PRO section.
That’s where the 3 signals come together into 1 chain.
Where I show you the single pillar still holding equities up.
Where I tell you what happens to the S&P if profits slip by just 10%.
And where I give you the date, 6 days from now, that decides which way this breaks.
I’ve seen pieces line up like this only twice before. I didn’t like what came next either time.
So let’s start at base camp.
With a birthday cake.
🎂 5 bulls reached their 4th birthday. 5 out of 5 saw their 5th
This is the most optimistic chart I’ll show you today.
Enjoy it for a moment.
The 5 bulls that made it this far lived, on average, 7.9 years and gained close to +290%.
Ours is 3.9 years old and up roughly +115%.
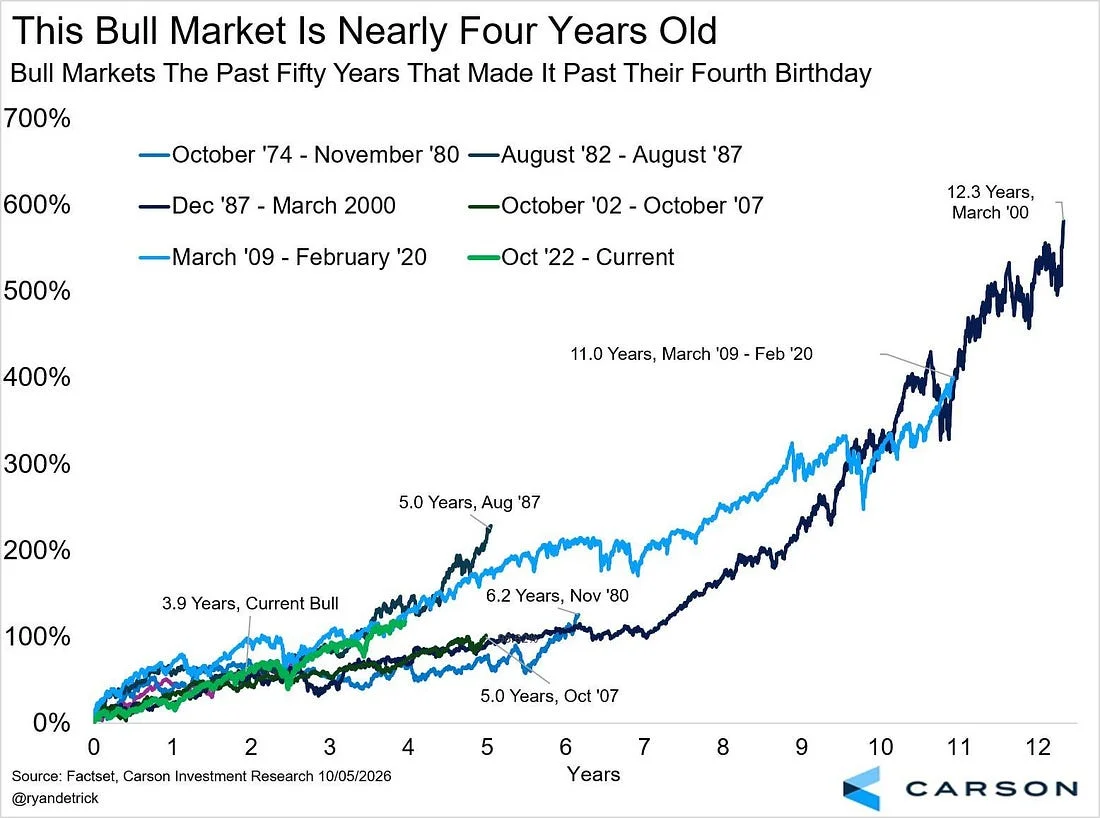
Even if it matched the shortest life on the list, 5.0 years, it would still have about 13 months of road ahead.
So why am I not uncorking anything?
Because I went and read the obituaries.
The 1974 bull, +126% in 6.2 years, died with the 10Y above 12% and heading for 15.8%. The S&P then lost 27%, while the dollar index went on to rise roughly 90% into 1985.
The 1982 bull, +229%, died after the 10Y climbed from 7.1% to 10.2% in just 10 months. The S&P lost 33.5%, and USD/JPY slid from about 150 to 122.
The 1987 giant, +582% in 12.3 years, died after the 10Y rose from 4.5% to 6.8%. The S&P lost 49%, the Nasdaq 78%, and EUR/USD sank to 0.83.
The 2002 bull, +101%, died with the 10Y at 5.3%. The S&P lost 57%, and USD/JPY collapsed from 124 to 87.
Only the 2009 bull, +400%, was taken by something no bond yield could have warned us about: a virus, and -34% in 33 days.
Line them up, and the cause of death almost writes itself.
In 4 out of 5 cases, the 10Y rose 1 to 3 points in the 12-18 months before the top.
The bigger and faster the rise, the deeper the fall.
There’s 1 more detail I can’t stop staring at.
The 1982 line, the one most like ours, added almost 90 points between year 4 and year 5. Its best year was its last.
Then, on October 19, 1987, the S&P lost 20.5% in a single session.
Bulls rarely leave quietly. They usually leave right after the party.
The lesson in my notebook: watch the 10Y, not the calendar.
Ours closed September at 5.30%.
Keep that number in your pocket.
In the PRO section, it returns with something that worries me more than its level: who is no longer buying it.
But before we talk about America, I want to show you what’s happening to everyone else.
🌍 17 years of US exceptionalism. 1 broken trendline
This chart divides the MSCI World ex-US by the S&P 500.
When the line falls, America wins.
It fell for 17 years, from about 0.23 to about 0.055: roughly -76% of relative value.
An entire generation of investors grew up with a single commandment: just own the S&P.
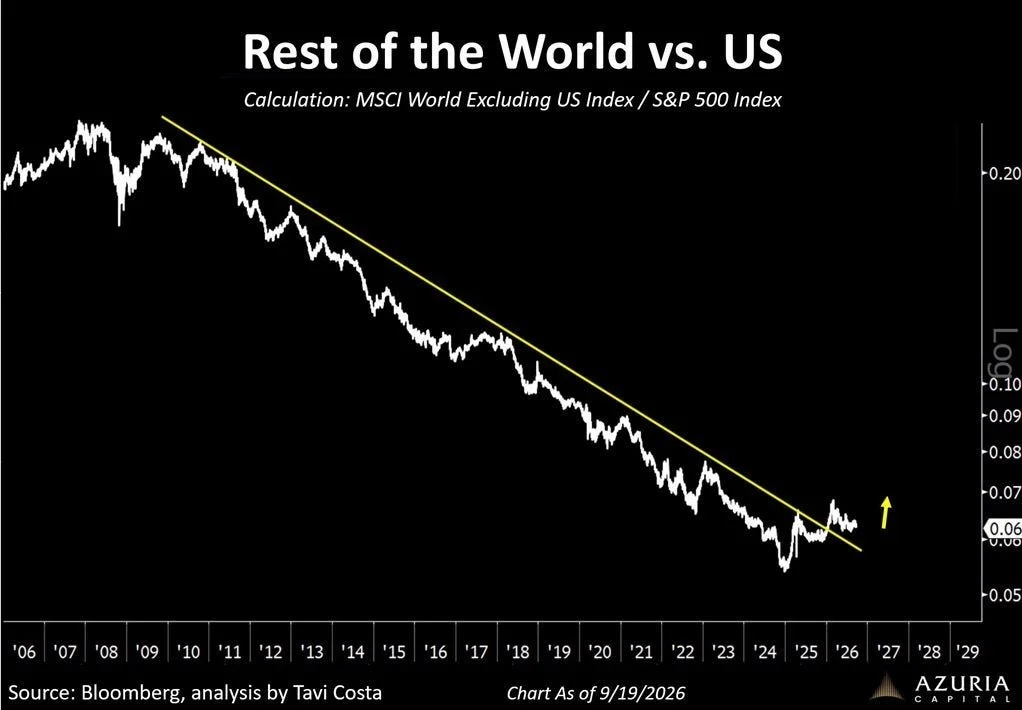
Now look at the right edge.
The ratio has broken the trendline that capped every rally since 2010, and it’s holding around 0.063, about +15% off the low.
When a 17-year trend breaks, I ask what drives it.
The answer has a name: the dollar.
Between 2002 and 2008, the dollar index fell from about 120 to about 72, roughly -40%, and EUR/USD climbed from 0.86 to 1.60.
International stocks beat the S&P 6 years in a row: +38.6% against +28.7% in 2003, +26.3% against +15.8% in 2006.
Then the film reversed.
From 2011 to early 2025, the dollar index climbed from 73 to 110, and this ratio lost about 70%.
And then came the first half of 2025.
The dollar index fell 10.7%, its worst first half since 1973. EUR/USD went from 1.03 to 1.18. International markets beat the S&P by more than 10 points that year.
This ratio is, for all practical purposes, an inverted dollar chart.
Every major turn since 2002 has coincided with a turn in the greenback.
A return to its early-2018 level, around 0.11, would mean the rest of the world outperforming by roughly 75%.
I’m not promising that.
I’m telling you the most comfortable trade of the century has stopped trending.
But this chart leaves a question hanging, and it’s the one that matters most.
If capital is leaving US assets, who replaces it as a buyer of US debt?
I’ll answer it at chart 6, in the PRO section.
You may not like the answer.
Investors aren’t the only ones moving. Central banks are too.
🥇 Central banks bought gold for the 5th month in a row
August: +39 tonnes. July: +23. June: +52.
China added +20 tonnes in August, +80 this year, and now holds a record 2,387 tonnes, about 9% of its FX reserves.
Poland added +8, +98 this year, for a record 648 tonnes.
I added up the bars.
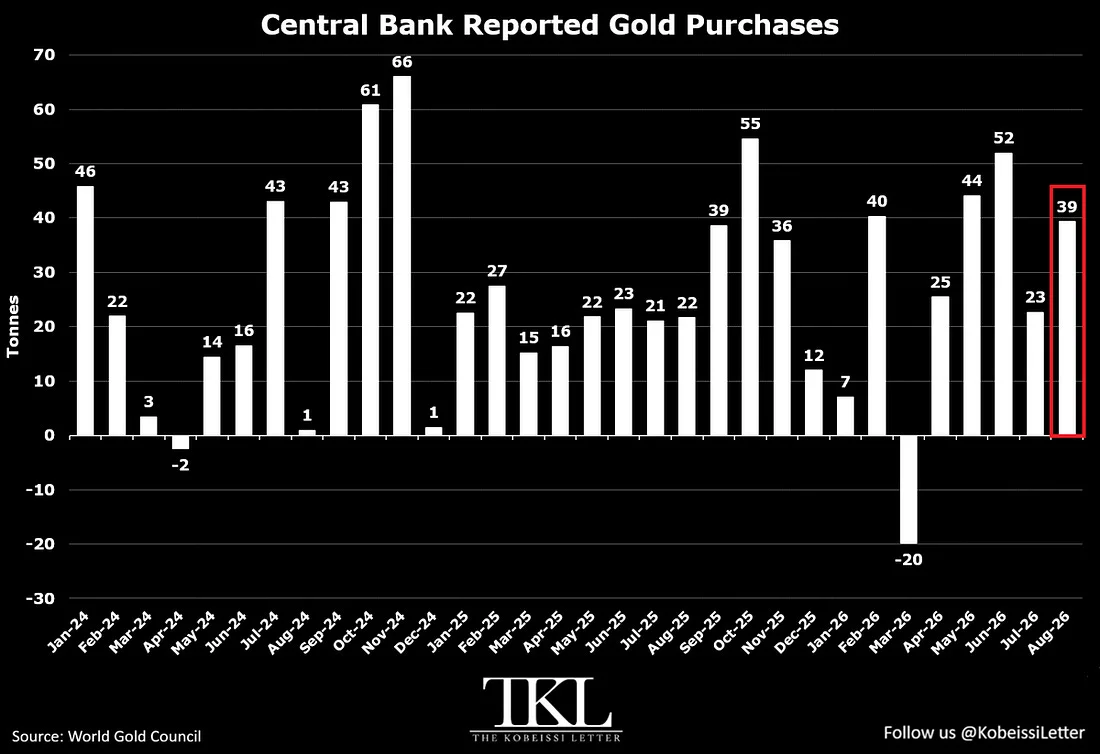
About 314 tonnes in 2024. About 310 in 2025. About 210 in the first 8 months of 2026.
Roughly 26 tonnes a month, every month, like a metronome.
This isn’t panic buying. It’s policy.
Go back to 1999.
European central banks had to sign an agreement to cap their gold sales at 400 tonnes a year. Gold bottomed at $252, with real yields around 4%.
It was the guest nobody wanted at the party.
In 2013, the old textbook worked perfectly. Real 10Y yields rose from -0.7% to +0.8%, and gold lost 28%, its worst year since 1981.
Then, in 2022, someone tore out the page.
Real yields rose from about -1.0% to +2.5%, almost 3.5 points, and gold went from about $1,800 to above $4,000 by October 2025.
+120%, against the strongest headwind in 2 decades.
The hand that tore the page is this chart.
Central banks bought 1,000+ tonnes a year for 3 years. A buyer absorbing a quarter of mine supply doesn’t care about real yields.
Carry this sentence with you into the PRO section:
Every tonne of gold that goes into a vault is a dollar of reserves that doesn’t go into Treasuries.
Chart 2 told you investors are diversifying away from America.
Chart 3 tells you central banks are doing the same.
Put them side by side, and the question becomes unavoidable: who is left to buy $40 trillion of US debt?
This is where the map ends.
The next 7 charts are the ones on my second monitor.
A crack in credit nobody on TV is talking about. And a simple multiplication that explains why stocks look invincible, and why that rests on a single pillar.
Everything up to here is what happened. Everything below is what it means.