
Dear Investors,
It’s Saturday afternoon, but this letter really began on Thursday.
Core CPI printed +0.3% against +0.2% expected. Headline came in at +0.4% against +0.3%, with the index at 337.51 instead of 337.02.
Then PPI jumped 6.5% Y/Y, the highest since November 2022, with core at 5.0%.
All this landed on core PCE at 3.1%, headline PCE at 3.6%, 165K jobs against 65K expected, unemployment at 4.1%, a September PPI up 1.3% in a single month and 2 FOMC members who had already voted for a hike in October.
Nasdaq futures slid 1.2%, S&P futures 0.5%. The 2Y yield jumped over 15 bp to 4.698%, the 10Y over 7 bp to 4.938%.
None of this kept me awake.
A sentence did.
Hours before the release, Christopher Waller had drawn a line in the sand. With core CPI at 0.3% or higher, he said, a 50 bp hike deserves a place on the table, and anything smaller could cost the Fed its credibility.
The number landed exactly on his line. To the decimal.
A coincidence, perhaps.
But over the next 48 hours I watched a pattern form that I’ve met only twice before, in 2022 and in 2000. I’ll tell you what it is. Just not yet.
First come the market’s bets, the bonds and the dollar. The real story begins after the 3rd chart, in the PRO section, together with the analog I wish I’d never found.
Keep one question in your pocket until the very last line.
Is the Fed about to fight the inflation of 2026, or the ghost of 2022?
🎯 82% for 25 bp, 12% for 50 bp and a tail that keeps growing
I always start where people put their money, with Kalshi’s market on the FOMC decision of December 9.
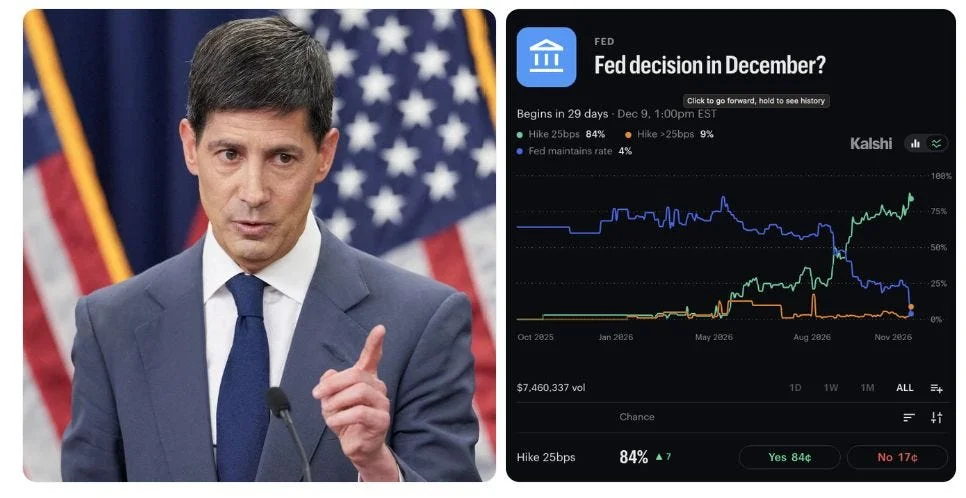
After CPI, a 25 bp hike sits at 82% (from 88%). A bigger move has jumped to 12% (from 5%). A hold has shrunk to 4% (from 8%).
CME FedWatch puts the odds of a December hike close to 100%.
Now look at the blue line.
From October 2025 to the summer, a patient Fed was the comfortable consensus at 60-80%. 12 months later the same crowd sees a Fed that hikes, and in a single day it started arguing about how much.
So I went back in time and found 4 of them.
In February 1995, the last of the cycle, the S&P 500 was up about 35% a year later and the 10Y about 150 bp lower.
In May 2000, also the last but after the Nasdaq peak, the S&P lost about 12% in 12 months and the Nasdaq about 45%, while the 10Y fell roughly 100 bp.
In May 2022, the first of a long cycle, the S&P lost about 5% and the 10Y rose about 45 bp.
In December 2022, the last one, the S&P gained about 18% with the 10Y up about 40 bp.
Markets don’t fear a 50 bp hike. They fear the one that turns out not to be the last, or the one that lands just as earnings roll over.
Which kind is December 2026? The answer lives in 2 charts in the PRO section, one on earnings and one on credit.
Hold that thought.
🌍 +50 bp across 8 economies and a bond market that stopped believing in cuts
Swaps tell me what they expect for a whole year, far beyond America. This Bloomberg chart averages the policy-rate change priced over the next 12 months in 8 economies.
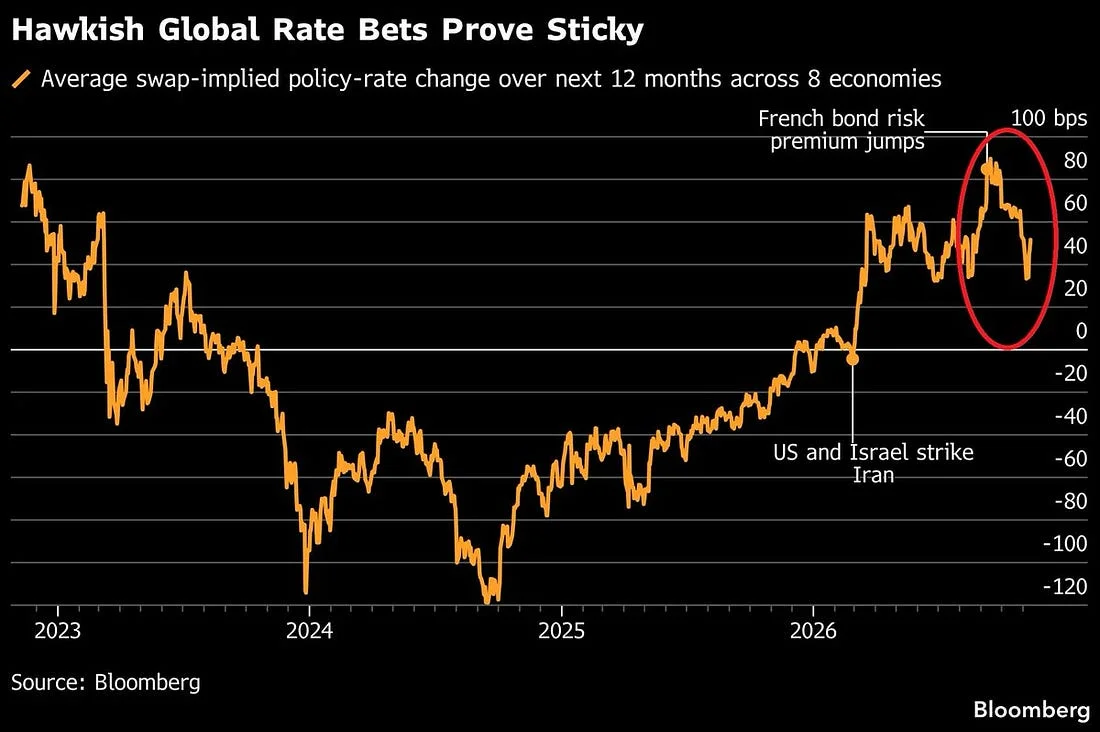
In autumn 2024 markets priced about 125 bp of cuts.
At the start of 2026 the line still sat near -10 bp. Then the US and Israel struck Iran, energy exploded and the line went vertical, touching almost +80 bp when the French bond risk premium jumped.
By November 6 it had cooled to +33 bp. One CPI later, it’s back above +50 bp. A swing of about 175 bp in 2 years.
The 2Y Treasury climbed 30 bp in 2 sessions to 4.89%, its biggest 2-day jump since March 2023 and near its highest since June 2024. The 10Y rose 26 bp to 5.13%, its largest move since April 2025.
Japanese and Australian yields are flirting with multi-year highs. French yields are surging again.
I’ve seen this film before.
In the 1994 bond massacre, the 10Y went from 5.2% to 8.0%, the S&P lost about 9% and the Mexican peso about half its value.
In the 2013 taper tantrum it doubled from 1.6% to 3.0%, the S&P dipped about 6% and the Indian rupee lost roughly 20%.
In 2022 it went from 1.5% to 4.2%, the S&P lost 25% and US bonds had their worst year on record, about -13%.
Between July and October 2023, a climb from 3.8% to 5.0% cost the S&P 10% and the Nasdaq about 12%.
Every time the 10Y jumped more than 100 bp in a few months, stocks paid a bill of 6% to 25%. And the bill was always heaviest when valuations had no cushion left.
How thick is that cushion today? Thinner than you think. A single number in the PRO section will show you.
💵 DXY at 102.91 and a dollar waking up after 19 months
When the whole world hikes and America looks ready to hike faster, money knows where to run.
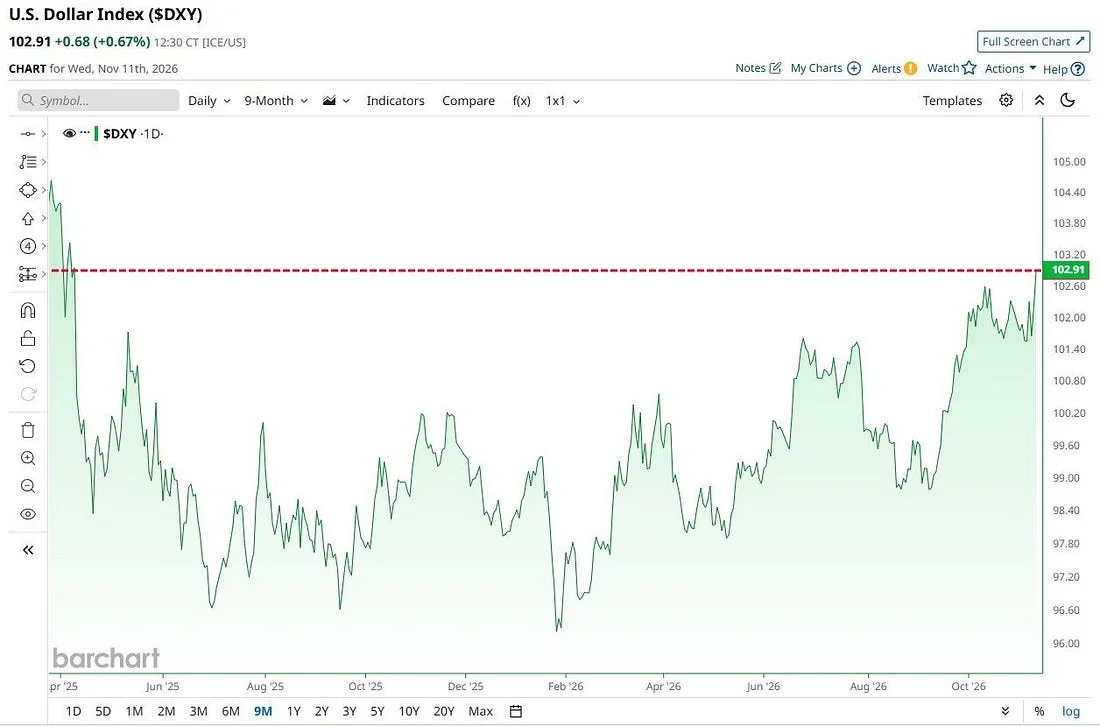
On Wednesday the Dollar Index closed at 102.91, up 0.68% in one session. Its highest level in 19 months.
The red dashed line sits where the dollar stood in April 2025, just before the slide to 96.6 in July. For over a year the DXY then lived in a box between 96 and 101, bottoming near 96.2 in February 2026.
Since then it has climbed about 7%, most of it in the last 2 months.
Every dollar rally I’ve studied sent the bill to someone else.
From July 2014 to March 2015 the DXY rose 25%, from 80 to 100. EUR/USD fell from 1.36 to 1.05 and oil lost about 55%.
In 2018 a 10% rally from 89 to 97 pushed EUR/USD from 1.25 to 1.13 and dragged emerging market stocks down 15%.
In 2022 the DXY gained 20%, from 96 to 115. EUR/USD broke parity at 0.96, USD/JPY flew from 115 to 152 and the S&P 500 lost 25%.
Then 2025 offered the mirror image. The DXY fell 12%, from 110 to 97, EUR/USD rose from 1.02 to 1.18, and those of us investing from Europe lost roughly 14% on US assets through the currency alone.
A strong dollar is monetary tightening exported to the rest of the world.
And today it moves with something much bigger than the Fed, visible only when you lay the next 7 charts side by side.
From here on, 7 charts take you below the surface.
A global regime change. A crowd that has never been this concentrated. Earnings that have quietly peaked. A crack at the bottom of credit. A bond market that contradicts the Fed. And an analog whose ending I don’t like at all.
This is where the real value of this letter lies.