
Dear Investors,
It’s Saturday afternoon, markets are closed, and it happens to be Halloween. A fitting day, because this week the scariest thing in markets wasn’t a crash. It was silence.
Have you noticed that the most dangerous moments are the quiet ones?
On Wednesday the Fed did exactly what everyone expected: nothing. Rates stayed at 3.75-4.00%, and within an hour the headlines had moved on.
I didn’t.
I printed the statement, put it next to September’s, and read them side by side with a coffee that went cold. Inside that boring decision I found 2 dissenting votes, 1 missing sentence, and a single word upgraded from “solid” to “strong”.
On their own, they mean little. Together, they tell a story the market isn’t pricing.
Last week I wrote that an event in Washington could send markets down one of two roads. I now know which road the Fed has chosen. I also know which road the market thinks it chose.
They’re not the same road.
The first 3 charts show what everyone can see: record earnings, a Fed that talked the market out of a hike, and a new chairman rewriting the calendar. Under each one I’ll leave a question open, on purpose.
The answers are in the PRO section, which starts with chart 4, and that’s where the real value of this letter lives. There I’ll read the statement line by line, dig up a forgotten 1994 precedent, measure America’s fiscal ceiling, and show you the dollar chart I consider the most important of the year for anyone who invests in euros.
Because for the first time in decades, the thing that has always protected European investors during a US sell-off may no longer be there.
At the end I’ll tell you how I’m positioning. But every good mystery starts with good news.
📊 EPS +33%, P/E -16% - the party nobody wants to pay for
When the first earnings reports came in, I smiled.
Of the 122 S&P 500 companies that have reported so far, 80% have beaten estimates, by an average of 560 bp. Trailing earnings are up 33% Y/Y, and the next-12-month estimate is up 39%.
Then I scrolled down to the bottom of Jurrien Timmer’s chart, and the smile faded.
The blue bars, EPS growth, have climbed to +33%, the highest since the post-Covid peak of +50% in 2021. The pink bars, the change in the P/E multiple, point the other way, at -16%.
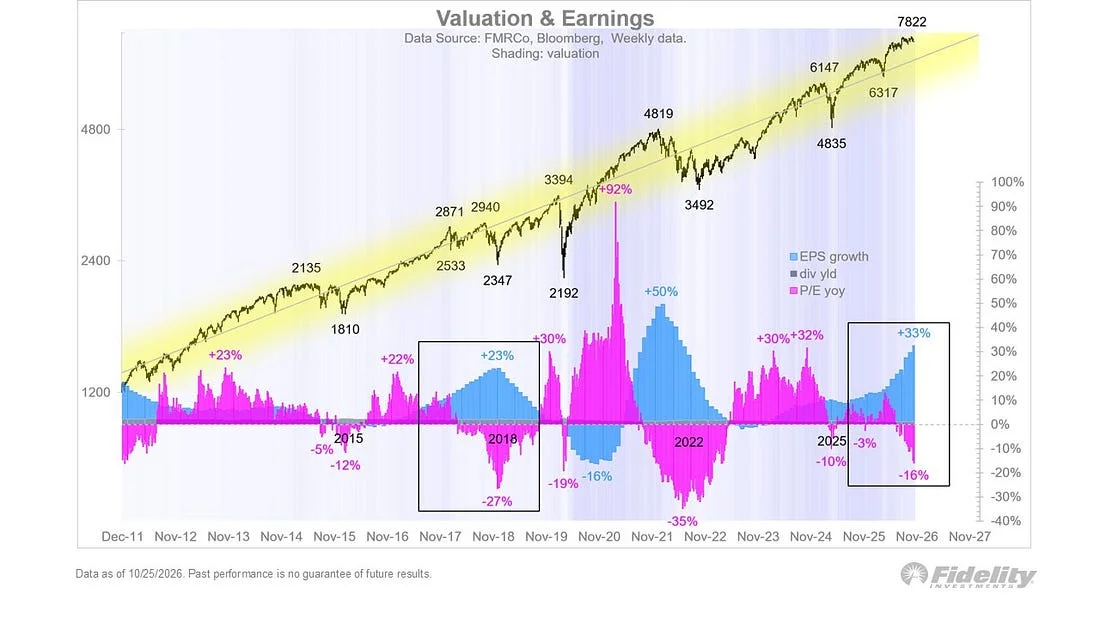
The index sits at 7,822, right on the ceiling of its long-term channel. But do the arithmetic, 1.33 × 0.84 ≈ 1.12, and you realise the entire +12% gain came from profits.
It’s like a restaurant that’s fuller than ever while the price of every dish keeps dropping.
Why? The gap between forward and trailing earnings is 19% and shrinking. Growth has stopped accelerating, investors rarely pay for the peak, and capital keeps getting more expensive.
Those 2 black boxes on the chart are what keeps me up at night.
In 2018 EPS growth peaked at +23%, the P/E fell 27%, and the S&P slid from 2,940 to 2,347. In 2021-22 growth peaked at +50%, the multiple fell 35%, and the index dropped from 4,819 to 3,492.
So I dug further back and looked at the 12 months after each earnings-growth peak: +4% after 2004, +10% after 2010, +2% after 2018 and -12% after 2021.
That averages roughly +1%, against the 10% or so of a normal year, with an average drawdown of -17% along the way. Earnings kept rising every time. The multiple did the damage.
My arithmetic for today: if EPS growth cools to +12-15% and the P/E gives up another 10%, the S&P lands around 7,900-8,100. If the multiple takes a 2018-style -20% hit, we’re looking at 7,000-7,200.
The difference comes down to one variable: the Fed.
And this week the Fed said something that never made the headlines. Keep that thought in your pocket. I’ll take it out in the PRO section.
🎙️ From 72% to 18% - how 3 sentences cancelled a hike
This orange line is a lesson in power.
In late September, fresh from the first hike since 2023, traders gave an October hike a 58% chance, and soon more than 70%.
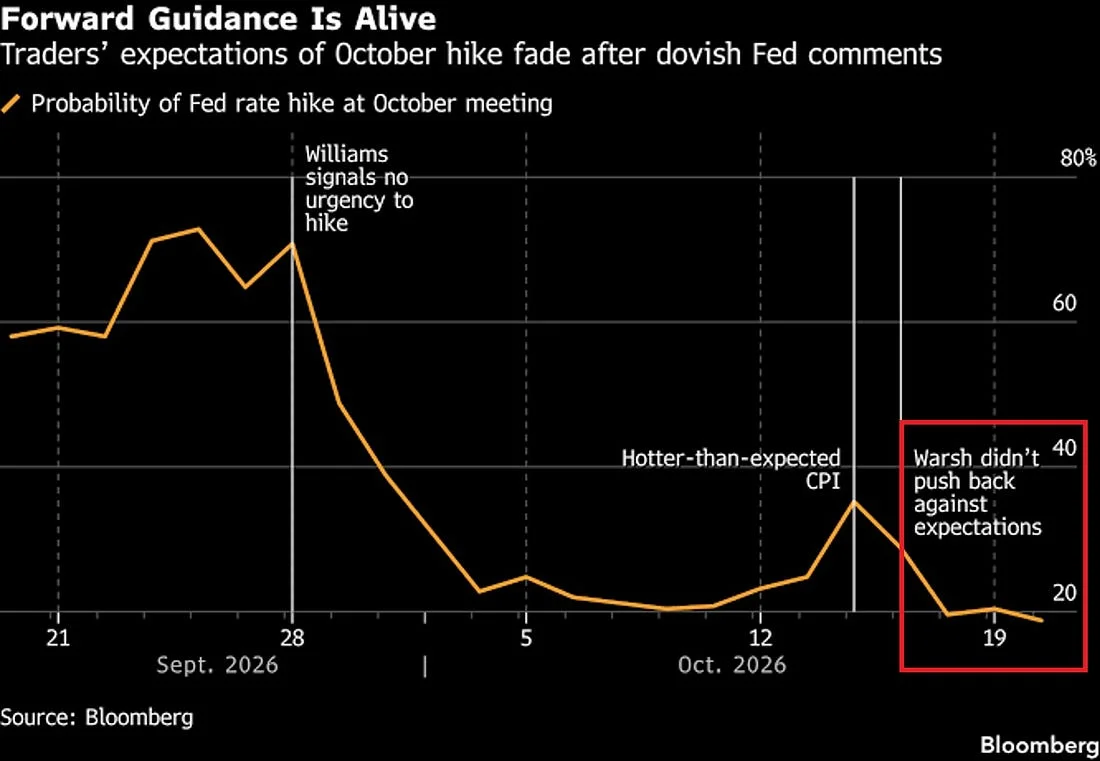
Then, on September 28, John Williams calmly said there was no urgency. A week later the odds were down to about 22%.
The hot September CPI briefly brought them back to life: core +0.3% M/M against +0.2% expected, annual core up to 2.6% from 2.4%, headline at 3.7%. The probability jumped to ~35% in a single session.
Then comes the red box: Warsh didn’t push back. In central-banking language, silence is a sentence. 3 sessions later the odds were below 20%.
Payrolls finished the job: +29,000, with -60,000 in revisions and unemployment at 4.2%.
I’ve seen this film before, and I bet you have too.
In July 2012 Mario Draghi said 3 words, “whatever it takes”. Within 6 months the Italian 10Y BTP fell from 6.6% to around 4.3%, the FTSE MIB gained about 40%, and EUR/USD went from 1.21 to 1.36.
In May 2013 a mere hint of tapering sent the US 10Y from 1.6% to 3.0% in 4 months, while the S&P lost 6% and emerging markets 15%.
In January 2019 Powell said “patient”, and the S&P rallied 25% from its Christmas Eve low in 4 months.
In August 2022 he spoke for 8 minutes at Jackson Hole. The S&P fell 3.4% that day and 12% into October, while the dollar hit a 20-year high.
Not one of those rates changed. The words were the policy.
Today the market still prices a December hike and roughly 75 bp of tightening through September 2027. But the mood is relaxed.
That relaxed mood is exactly what bothers me.
When I read the statement line by line, I found 2 people in that room who did not want to wait at all, and a sentence the Fed quietly erased. I’ll show you both in the PRO section.
🏛️ Fewer meetings, bigger stakes, and a test that hasn’t come yet
Look at that half-smile. That’s a man about to change the rules.
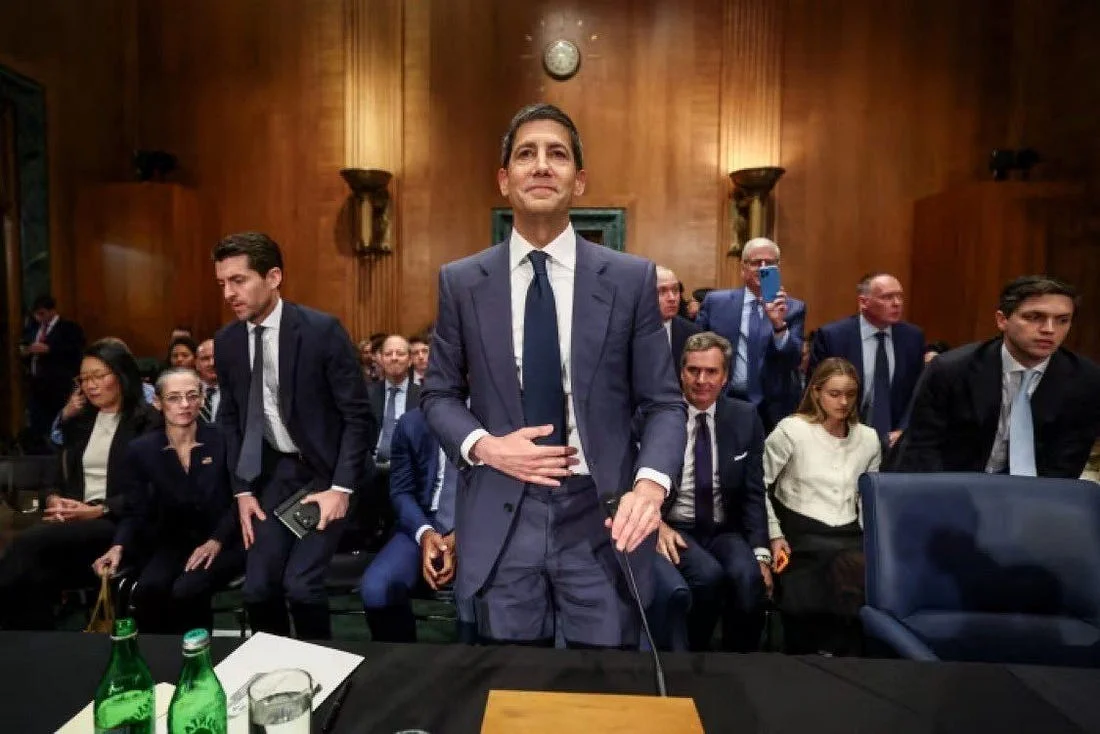
The real news from Warsh’s press conference wasn’t the rate decision. It was this: from fall 2027, 1 of the 8 FOMC meetings will be devoted to long-term strategy, with no rate vote, and by 2028 he expects just 6 rate-setting meetings a year.
8 has been the norm since 1981.
He added that the “monetary medicine is starting to work”, that he’s “unwilling and unable” to call conditions tight, and that inflation remains elevated.
Why should a calendar matter to you? With 6 decisions instead of 8, each carries roughly a third more weight. That means bigger moves or longer holds, and more volatility around every meeting.
And a chairman who refuses to call conditions tight with the S&P at 7,822 is telling you, very politely, that policy isn’t restrictive enough yet.
One more thing nags at me.
Warsh was sworn in on May 22, 2026, and markets have a habit of testing every new chairman, like a class testing a new teacher.
Greenspan took office in August 1987 and within weeks faced Black Monday: a -33% drawdown, and an S&P down 21.2% a year later. Powell started in February 2018 and endured a -19.8% slide before the year was out.
Volcker, Bernanke and Yellen got off lighter, with drawdowns of roughly 10%, 8% and 7%, and 12-month gains of 16.5%, 12.7% and 17.7%.
According to Barclays, the average first-year maximum decline across every chair since 1929 is about -20%. Still, in 4 of these 5 cases the market was higher a year later. The test usually turned into an opportunity.
5 months in, Warsh hasn’t been tested yet.
Tests tend to arrive when a chairman has to choose between two things he can’t have at the same time. In the PRO section I’ll show you which two things Warsh is about to choose between, and why that choice runs straight through the dollar in your portfolio.