

Dear Investors,
Some weeks you forget by Tuesday.
Others you end up telling friends about 10 years later, usually starting with “do you remember when”. I’m fairly sure this was one of the second kind.
Yesterday evening I switched off my screens with a feeling I struggle to describe. It wasn’t panic, because panic is loud and this was quiet.
It was the sensation that a handful of numbers I’d been following for months had suddenly lined up, like the tumblers of an old lock clicking into place.
The Nasdaq 100 lost 10.43% in 5 sessions. The VIX went through 31. The Chair of the Federal Reserve said something I honestly never expected to hear from a sitting Fed Chair.
And while the whole world was staring at the tech giants, 3 other markets were moving without making a sound, in corners almost nobody checks on a Friday night. Bonds, the dollar and gold.
The first part of this letter covers what everybody saw, the size of the shock. It says nothing about how it ends.
The answer sits in 5 charts I’ve kept for the PRO section. One of them has appeared only twice in 40 years, and both times it marked the end of one market and the birth of another.
📉 -10.43% and the week the textbook broke
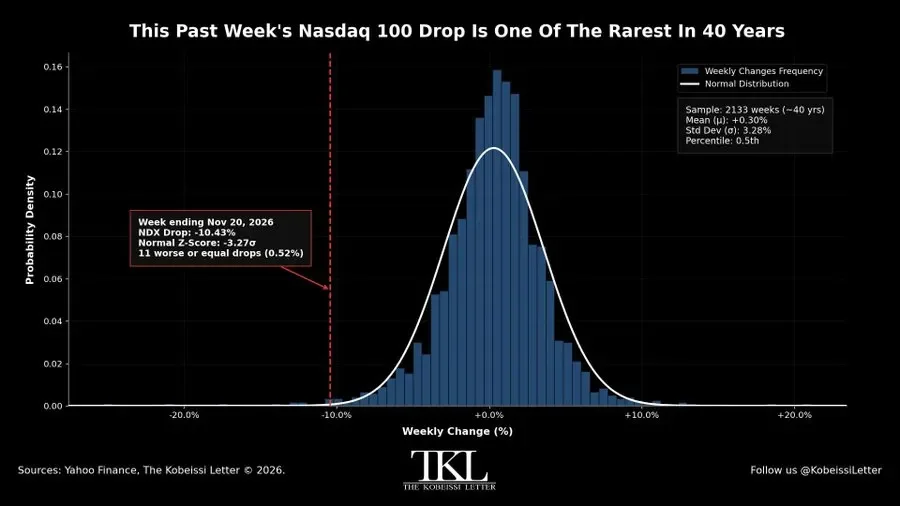
The Nasdaq 100 closed the week ending November 20 down 10.43%.
I went back through 2,133 weeks of data, roughly 40 years. The average week returned +0.30%, with a standard deviation of 3.28%.
This week landed 3.27 standard deviations below that average, in the 0.5th percentile. In 40 years only 11 weeks were as bad or worse, about one every 8 years.
Then I found the detail that kept me at my desk.
If markets really followed the normal distribution of the textbooks, a -3.27σ week would have a probability of about 0.054%. Over 2,133 weeks we should have seen one.
We’ve seen 11.
The left tail of the equity market is about 10 times fatter than the models admit. Extreme weeks aren’t black swans. They’re regular guests who never ring the bell.
So who were the other guests?
In October 1987 the S&P 500 fell 34%, the 10Y yield dropped from 10.2% to 8.9% in weeks, and the recovery took about 2 years.
In the dot-com bust the Nasdaq 100 lost 83%, the 10Y yield slid from 6.7% to 3.6%, and the S&P 500 needed about 7 years to recover.
In the GFC the S&P 500 lost 57%, yields fell from 5.3% to 2.1%, and EUR/USD collapsed from 1.60 to 1.25 in 4 months.
In 2020 the S&P 500 lost 34%, the DXY jumped 8% in 10 days, and 5 months later it was all forgotten.
And in 2022 the Nasdaq 100 fell 35% while the 10Y yield did something it hadn’t done in any of the other episodes. It went up, from 1.5% to 4.2%.
Lined up, those stories say something uncomfortable. The size of the fall never decided the ending.
What made the difference was always the same trio. How expensive the market was, what the Fed did, and whether bonds moved with stocks or against them.
The first two you’ll see in a moment. The third, the bond market, did something this week that I consider the most important signal of all. I’ll come back to it in the PRO section, because that’s where this story really turns.
🛡️ The sentence that changed the tone of the week
Right in the middle of the selloff came the sentence.
Fed Chair Warsh said the Fed is preparing for a scenario in which the AI boom fails, stocks fall and the US economy slows.
I read it 3 times. In my experience a central bank doesn’t talk publicly about contingency plans for an equity bust unless somebody inside the building has started to treat it as a real possibility.
The market’s reflex was instant. Fed put, the cavalry is coming.
I’d be careful. Every put has a strike price, and this one is written in inflation.
Fed funds futures, measured as the 12th contract minus the 1st, are pricing around +90 bp of tightening over the next 12 months, the first real hiking bias since 2022. And the Hormuz shock has pushed energy prices and yields higher at the same time.
The Fed put has always had 2 faces.
In 1987 a liquidity pledge and about 50 bp of cuts were enough, and a year later the S&P 500 was up about 23%. In 1998, with LTCM, 75 bp of cuts in 7 weeks fuelled a rally of about 35% from the October low. In 2020 rates at zero and unlimited QE lifted the index about 75% in a year.
But in 2001 the Fed cut 475 bp and the S&P 500 was still down about 15% a year later, and 40% by October 2002. And from September 2007, 500 bp of cuts couldn’t stop a fall of about 21% over the following 12 months.
What separated the 2 faces was never the size of the rescue. It was the starting point.
The put worked when inflation was low and valuations were reasonable, and failed whenever the Fed was cutting into a deflating bubble.
So which starting point do we have today? To answer that I need the second chart.
🏔️ 37.9x, the valuation that doesn’t forgive
After the selloff the Shiller P/E has come down from a cycle high of 41.0x to 37.9x.
A 7.6% de-rating sounds like a lot, until you look at the chart and realise it barely registers.
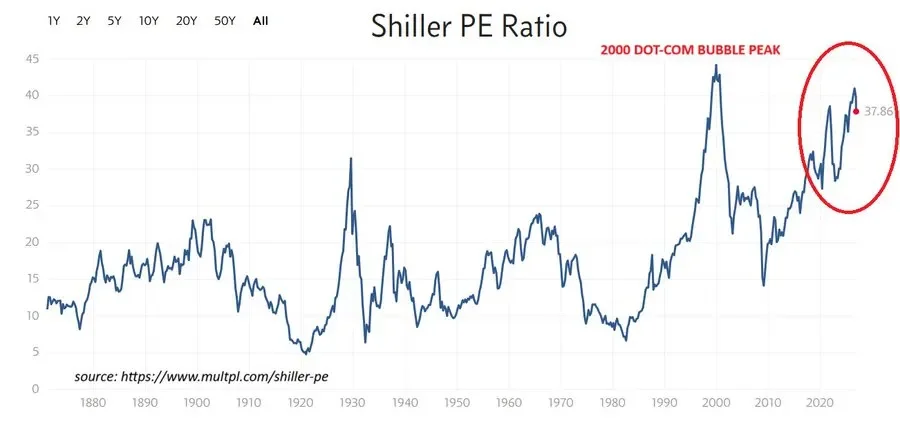
For scale, the long-term average since 1871 sits around 17x. The 1929 peak was about 32x and the December 1999 record was 44.2x. After the 2020 crash and at the end of the 2022 bear market the ratio was below 30x.
So even after the worst Nasdaq week in years, we’re still at the third-highest level since that bubble burst.
I’ve always thought of the CAPE as a terrible clock and an excellent compass. It won’t tell you when, but it tells you a lot about how much.
Those who bought in August 1982, with a CAPE around 7x, earned about 13% a year in real terms over the following decade. Those who bought in March 2009, near 13x, made about 14%.
Those who bought in September 1929, near 32x, made roughly nothing. And those who bought in December 1999, at 44.2x, lost about 3% a year for 10 years.
The higher the starting point, the poorer the next decade. Today we stand much closer to 1929 and 1999 than to 1982 or 2009.
If earnings hold, a CAPE back to 30x, roughly where it was in 2022, would mean another 21% lower. At 25x, normal in the 2010s, about 34% lower. I just want you to see how thin the cushion is.
Today’s leaders do have higher margins than the stars of 1999, and they deserve a premium, though not one that ignores what the Fed Chair has just said.
And this is where the Fed put story gets complicated. Today we have the valuations of 2000 and 2007, the 2 times the put failed.
😨 VIX at 31, fear is good but not for everyone
Then came the third piece of the puzzle. Yesterday morning the VIX crossed 31, its highest level since March. Anything above 28.5 puts the fear index in its top decile since 1990.
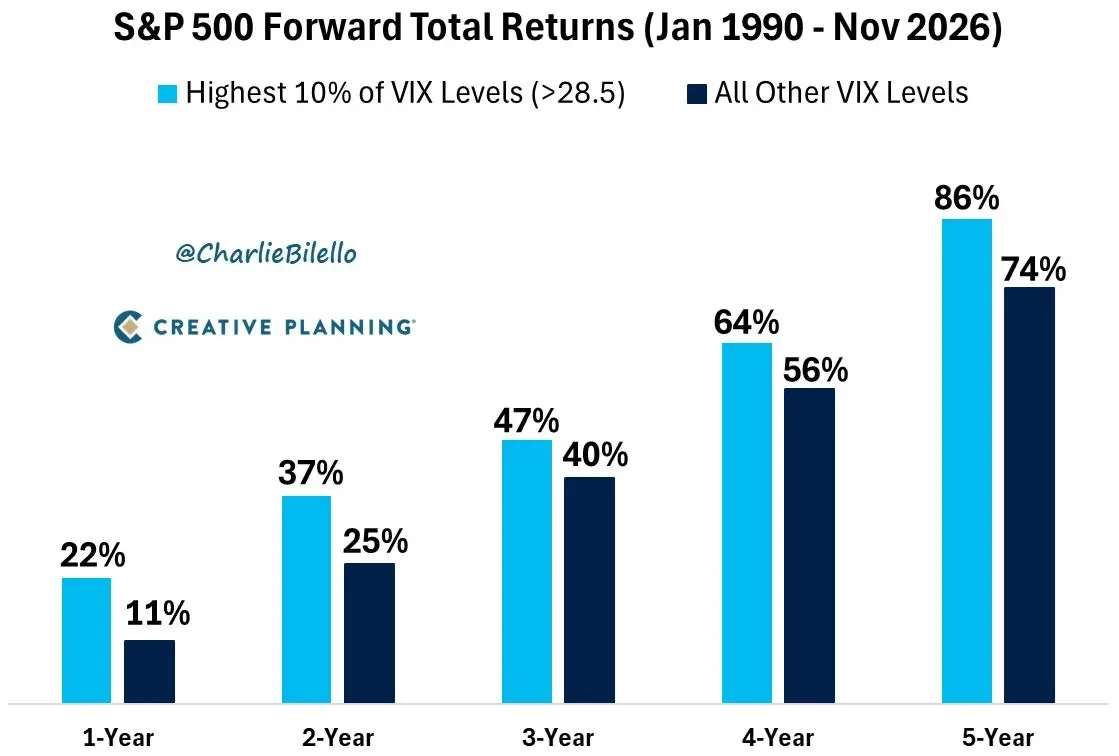
Charlie Bilello’s work at Creative Planning, covering January 1990 to November 2026, shows that buying the S&P 500 when the VIX was in its top decile beat buying at any other moment, at every horizon.
One year later the high-fear entry points returned +22% on average against +11%. Five years later, 86% against 74%.
After the VIX closed at 80.9 in November 2008, the S&P 500 gained about 45% in a year. After the record 82.7 of March 2020 it gained about 66%. After the 52.3 of April 2025, about 30% within 6 months.
But I wouldn’t be honest if I stopped there.
On September 29, 2008 the VIX closed at 46, and in the months that followed the S&P 500 lost another 39% into the March 2009 low. A high VIX can also be early.
That’s why in moments like these I keep one eye on the yen. In late 2008 USD/JPY fell from 110 to 87. In the summer of 2024 it went from 161.9 to 141.7 in a month as carry trades unwound. When the fear is real, the yen usually tells you before the headlines do.
So yes, fear is good, for those who can stay invested through the next spike.
And this is where the free part of my letter has to stop.
These charts tell you the shock is real. They don’t tell you which film we’re watching, whether it’s 1998, 2000, 2008 or 2020.
That answer is hidden in 5 charts very few people are reading together.
A bond market that, this week, quietly stopped doing its job. A dispersion inside the S&P 500 seen only twice in 40 years. A dollar that has just broken out of a 2-year base. And a gold market that Goldman has downgraded once again, while a liquidity model says it’s 29% undervalued.
Put them side by side and they sketch a scenario I don’t think the market is pricing yet. That’s where the PRO section begins.