
Dear Investors,
The Anatomy of the Cycle: Short-Term Fixes, Long-Term Problems
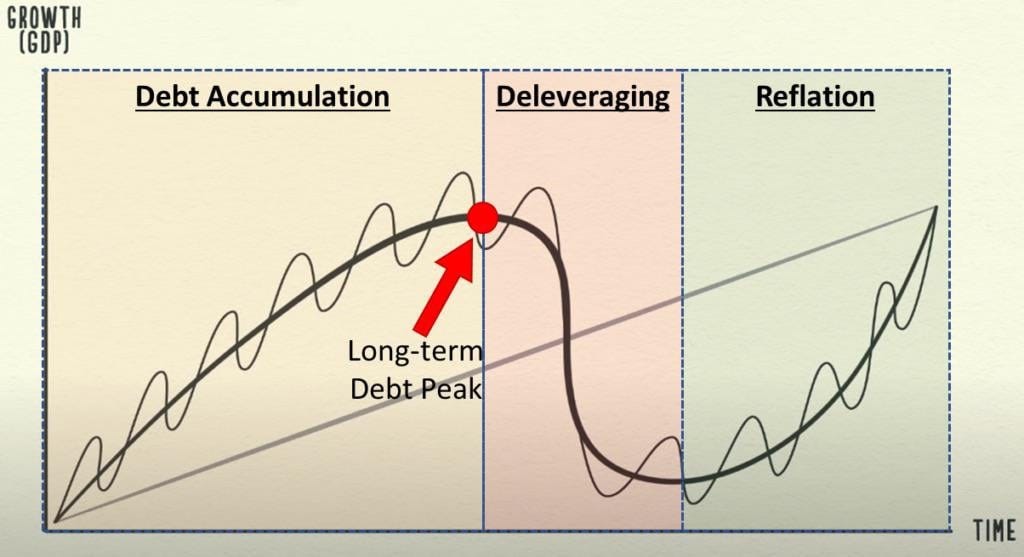
Dalio’s framework starts with a simple idea: debt allows spending to exceed income in the short term. That’s great for growth – until it isn’t. In normal business cycles, central banks raise and lower interest rates to manage expansions and recessions. These are short-term debt cycles – lasting roughly 5 to 10 years. But over time, each cycle leaves behind more debt than before. Why? Because instead of letting debt fully clear, policymakers stimulate further – lowering rates, easing conditions, pushing growth forward. This leads to a slow buildup of debt relative to income – until eventually, it becomes unsustainable. Dalio shows how, over decades, this process creates a massive imbalance. At the peak of a long-term debt cycle, households, corporations, and governments are all so indebted that traditional monetary tools stop working. Rates can’t go lower. Debt can’t grow faster than income. And suddenly, the system needs something more dramatic: deleveraging. That’s when history gets interesting.
Deleveraging and the Four Levers of Escape
Dalio identified four ways societies deal with too much debt:
Austerity – Cut spending, raise taxes, reduce borrowing 2. Debt restructuring – Defaults or write-downs 3. Money printing – Inflate the debt away 4. Transfers of wealth – Often through fiscal policy or political conflict
These levers are usually used in combination. But the most common – and most politically acceptable – is the third: printing money.
When I studied the 1930s Great Depression and the 2008 financial crisis through Dalio’s lens, I saw the same pattern: a long buildup of private debt, a sudden collapse in credit creation, followed by massive central bank intervention.
And most recently, in 2020 and 2021, we saw the same process – just faster.
When COVID hit, global debt exploded past 350% of GDP, and central banks responded with over $25 trillion in combined liquidity injections.
This wasn’t just crisis response. It was a continuation of the long-term cycle, nearing its end.
Dalio teaches us that at this stage, inflation becomes harder to control, inequality rises, and political polarization accelerates.
It’s not just economics – it’s systemic tension. And investors who ignore it are flying blind.
How I Apply This Framework to Markets Today
Once I absorbed this idea, I stopped treating every policy decision as isolated.
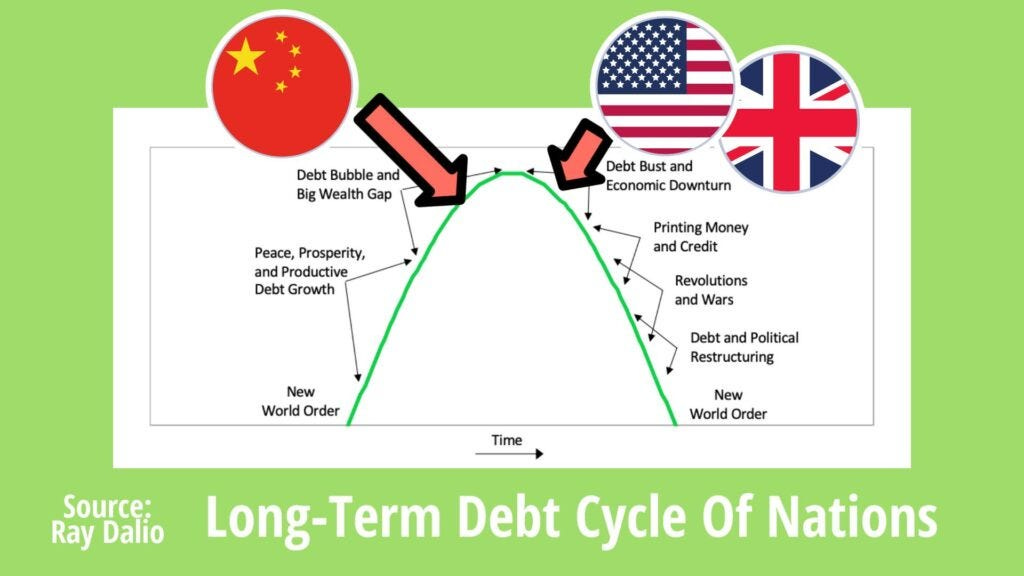
I started asking: Where are we in the long-term cycle? Is this easing or tightening solving anything – or just delaying the reset?
When I looked at Japan in the 1990s, I saw a textbook case.
After its bubble burst, the country entered a long deleveraging phase – zero rates, QE, fiscal deficits, aging demographics.
For decades, growth was modest, inflation elusive. That wasn’t bad luck – it was the endgame of a debt supercycle.
Then I turned to the U.S. post-2008. Same story: asset prices rescued, debt unaddressed.
In 2020, we skipped even the recession – going straight to helicopter money. The result? In 2021 and 2022, we got the highest inflation in 40 years.
When inflation surged, many called it “transitory.” But from a long-term cycle perspective, it was inevitable.
Too much money, too much debt, too little productivity. The system had reached its outer limits.
Now I monitor the key Dalio signals: rising real yields, declining effectiveness of rate cuts, policy trapped between inflation and growth.
And I position accordingly – with hedges for currency debasement, exposure to real assets, and a strong awareness that resets don’t look like recessions – they look like regime shifts.
What This All Means
Ray Dalio didn’t give us a tool to time the next trade. He gave us a lens to understand when the rules of the game change.
His long-term debt cycle teaches us that macro isn’t just about short-term catalysts – it’s about the structure of the system, and how it breaks down when stretched too far.
Don’t just ask where the market is heading. Ask where the system is heading.
Ask whether the next policy move is solving a problem – or simply buying time.
And position your portfolio with the humility that, sometimes, entire eras end.
Next week, we’ll enter the bond market through the lens of Jeff Gundlach – the man known as the “Bond King,” and one of the most insightful macro thinkers alive.
We’ll explore how yields signal turning points before equities notice.